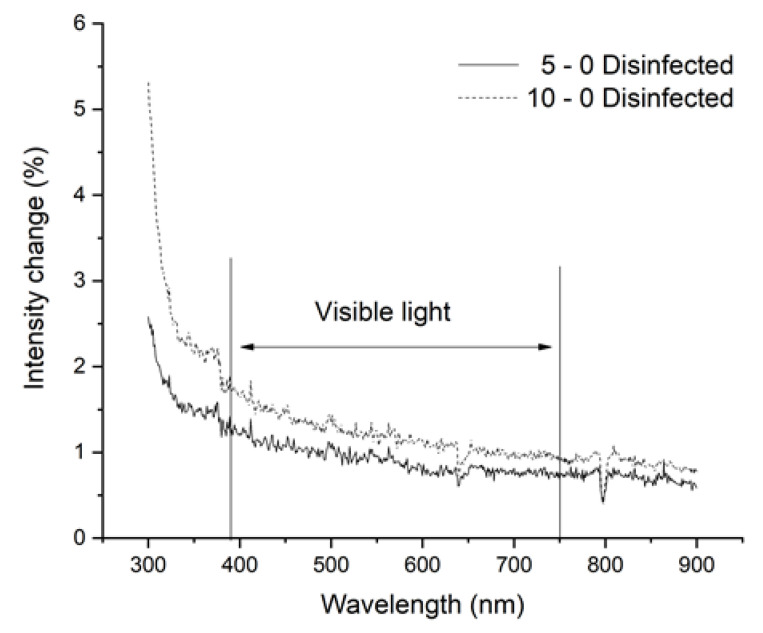
Figure 6.
Results of spectrophotometry. The measurements were performed between 300 and 900 nm wavelength. The threshold of visible light is indicated. The changes in intensity have been visualized (%), where the smooth line marks the results of test samples after five cycles, and the dotted line represents the test samples after 10 cycles. The values of intensity are subtracted from the baseline, which was determined using non-disinfected samples.

