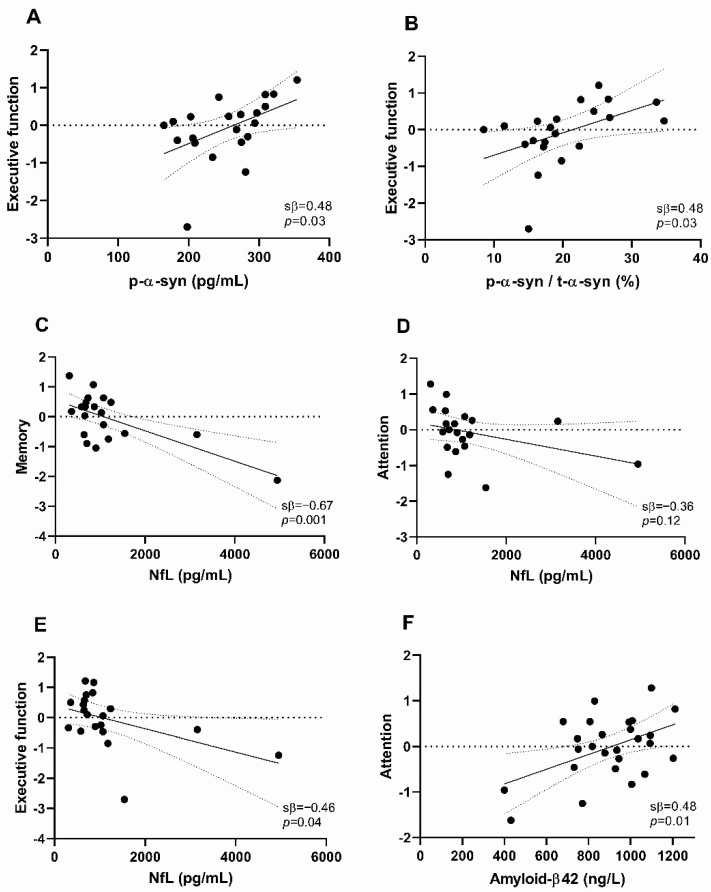
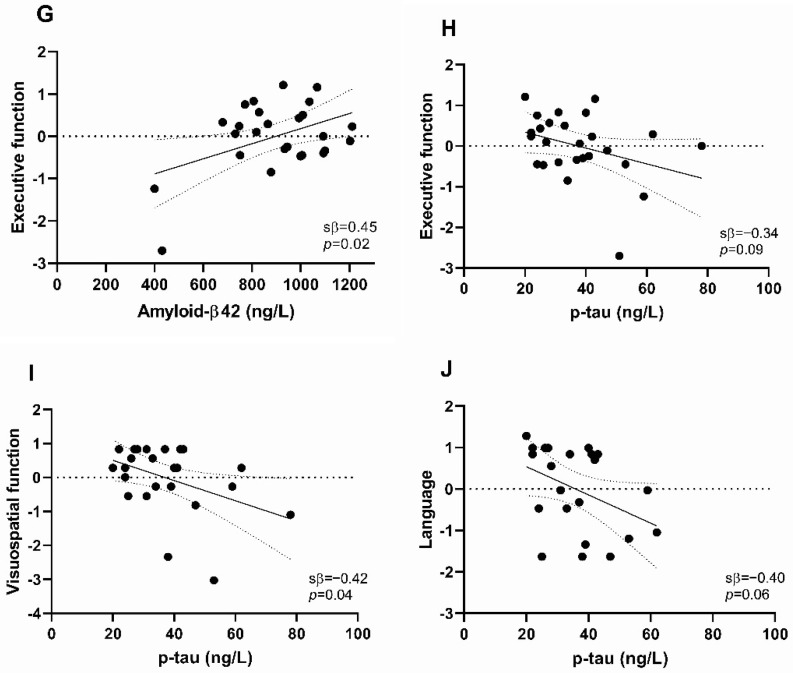
Figure 2.
Scatter plots illustrating the relatively strongest associations of cerebrospinal fluid (CSF) biomarker levels with cognitive domain scores in early-stage Parkinson′s disease patients. Associations between (A) CSF p-α-syn and executive functioning, (B) CSF p-α-syn/t-α-syn ratio and executive functioning, (C) CSF NfL and memory, (D) CSF NfL and attention, (E) CSF NfL and executive function, (F) CSF amyloid-β42 and attention, (G) CSF amyloid-β42 and executive function, (H) CSF p-tau and executive function, (I) CSF p-tau and visuospatial function, (J) CSF p-tau and language. Data are standardized regression coefficients from univariable linear regression models. A solid line indicates a linear regression, while dotted lines have 95% confidence intervals. Each dot in the scatter plot represents a subject. Abbreviations: CSF, cerebrospinal fluid. p-α-syn, phosphorylated α-synuclein. t-α-syn, total α-syn. NfL, neurofilament light chain. p-tau, phosphorylated tau. sβ, standardized β-coefficient.


