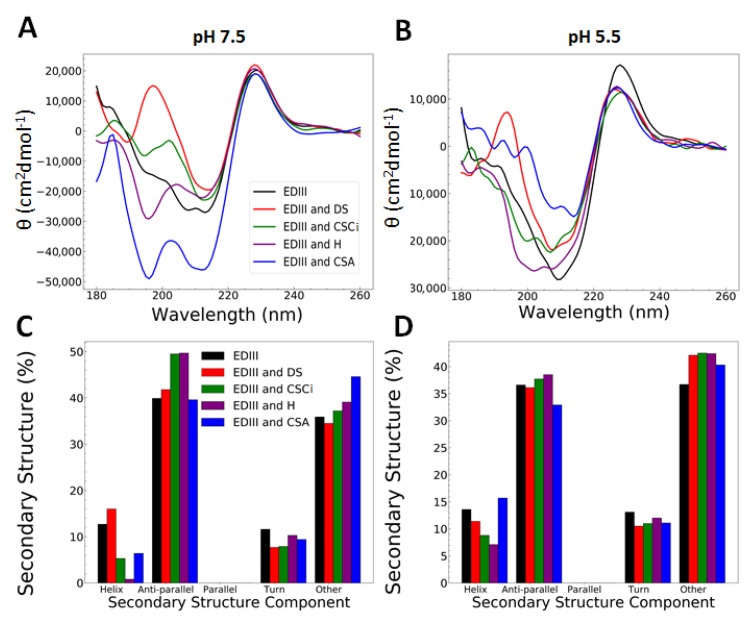
Figure 3.
CD analysis of 6xHis-tagged EDIII post incubation with glycosaminoglycans (GAGs). (A,B) Wavelength spectral analysis of EDIII with dermatan sulphate (DS), Chondroitin sulphate C from shark cartilage (CSCi), heparin (H), and chondroitin sulphate A (CSA) pH 7.5 (A) and pH 5.5 (B). (C,D) Deconvolution of EDIII wavelength spectra with GAGs at pH 7.5 (C) and pH 5.5 (D) using beta structure selection server (BeStSel) [27].

