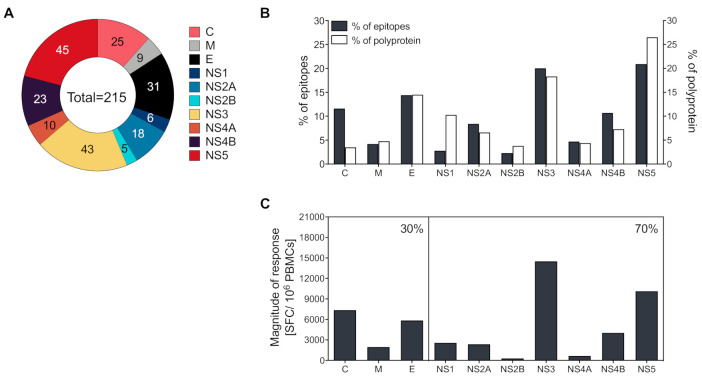
Figure 1.
Protein location and magnitude of response of CD4+ epitopes identified. (A) Patterns of protein immunodominance of CD4+ T cells responses against yellow fever virus (YFV) epitopes. The fraction of identified epitopes is plotted as a function of the protein they are derived from (capsid protein [C], membrane protein [M], envelope protein [E], non-structural protein 1 [NS1], NS2A, NS2B, NS3, NS4A, NS4B, and NS5). Numbers represent the number of epitopes identified. (B) Relative distribution of epitopes derived from the structural (C, M, and E) or NS proteins (NS1–5). The gray bars reflect a relative number of peptides for each protein predicted to bind the various HLA-DR molecules, and the white bars show the percentage of all possible peptides (percentage of the YF-17D polyproteins) accounted for by each antigen. (C) The magnitude of response per structural (C, M, and E) or NS proteins (NS1–5). The magnitude of response was defined as the average sum total of spot-forming cells (SFCs)/donor associated with each protein. Percentages in the upper right corner reflect the relative response directed at either structural or NS protein responses.

