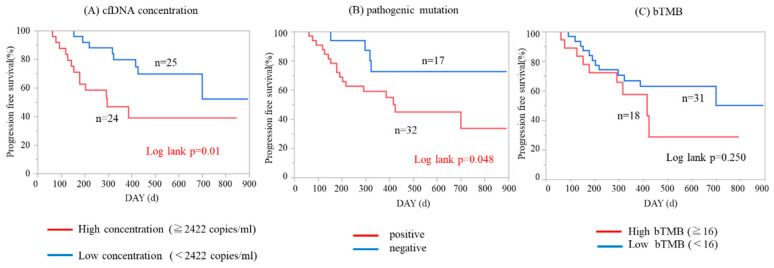
Figure 6.
Kaplan–Meier analysis of progression-free survival patients in all ovarian cancer patients (n = 49). (A) Patients with higher cfDNA concentration had significantly worse progression-free survival (PFS; p = 0.01 by log-rank test). (B) Patients with one or more pathogenic mutations had significantly worse PFS (p = 0.048 by log-rank test). (C) bTMB level was not significantly associated with PFS (p = 0.250).

