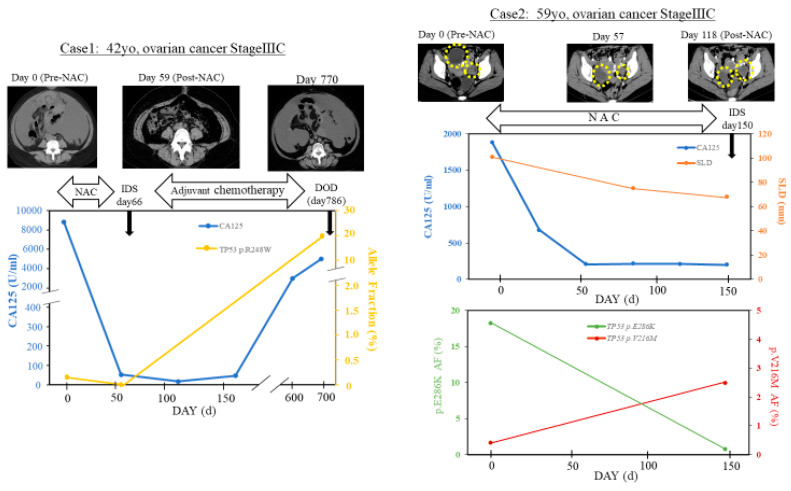
Figure 8.
Monitoring ctDNA in neoadjuvant chemotherapy (NAC)-treated ovarian cancer patients. The figures showed the time course of allele frequency of ctDNA, serum CA125 level, and sum of the longest diameters (SLD; only in case 2) with their clinical events and treatments as well as changes in computed tomography (CT) images. In case 1, TP53 R248W level in ctDNA (yellow line) was not detected after NAC alongside response to treatment. The allele fraction of TP53 R248W in ctDNA increased during the serum CA125 level (blue line) along with progressive disease. In case 2, two site mutations of TP53 (p.E286K, V216M) were detected before NAC. The patient responded initially to NAC, but SLD of the tumor (orange) and the serum CA125 level (blue) remained stable. After five cycles of NAC, the allele fraction of TP53 p.E286K (green line) decreased, while the allele fraction of TP53 p.V216M (red line) increased. SLD: sum of the longest diameters.

