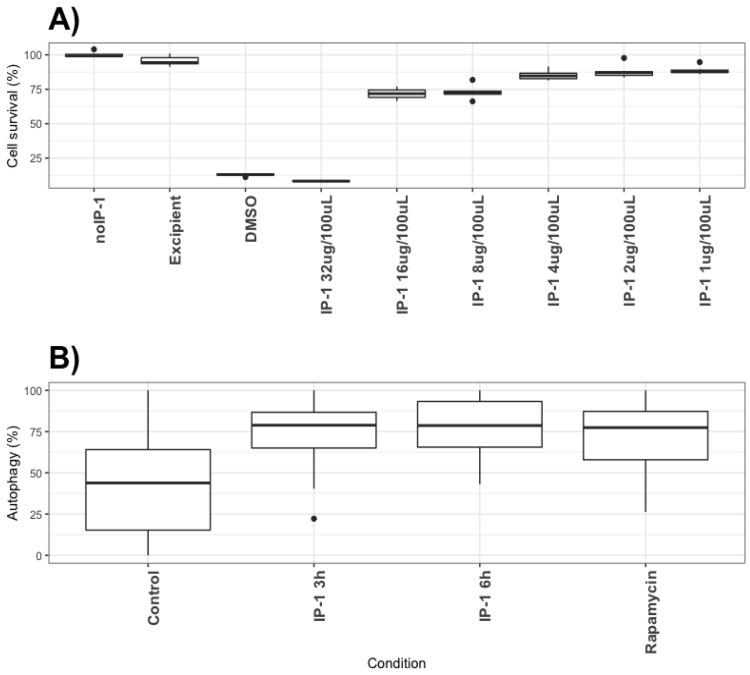
Figure 4.
Cytotoxicity and autophagy induction of IP-1 on macrophages. Top panel: (A) Percentage of macrophages (J774.1) staining with violet dye, as an indicator of cell survival (see Materials and Methods section). noIP-1 and Excipient shows percentage of staining on cells without IP-1; DMSO is a toxic agent to macrophages and serves as positive control for dead cells; different concentrations of IP-1 were used (1, 2, 4, 8, 16, and 32 μM) to test for the survival of macrophages. The data were derived from at least 3 to 6 independent experiments. Bottom panel: (B) The percentage of cells showing green dots as indicative of autophagy as detected by Cyto-ID (see Materials and Methods section). Control are cells not exposed to IP-1, Rapamycin show the results of cells exposed to the autophagy-inducer rapamycin, and the autophagy detected at 3 and 6 h in the presence of IP-1 are shown. These data were derived from at least 30 photographs obtained from 3 independent experiments. The statistical comparison between groups was performed using ANOVA test and the p-values were obtained from a Post-hoc analysis with Tukey test (see [34]). The black circles represent outliers.

