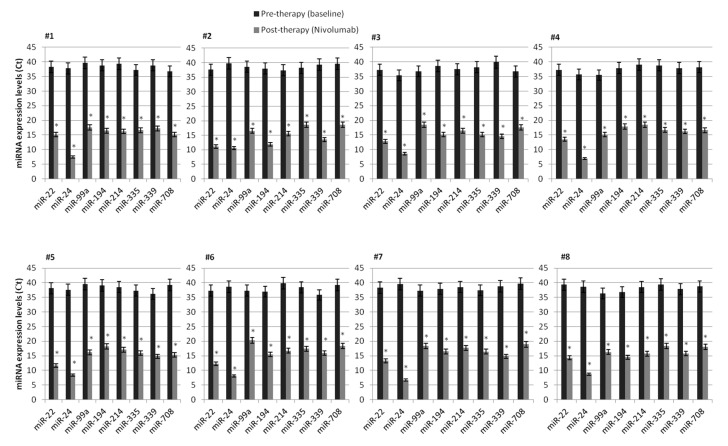
Figure 3.
Validation of microarray expression data of 8 specific miRNA in a cohort of 8 mccRCC patients by quantitative Real-Time PCR analysis. The expression of each miRNA was analyzed before nivolumab treatment (T0) and 4 weeks after treatment (T1). Data are presented as Ct values ± SDs. Undetermined values of Ct were estimated between 35 and 40 Ct (the last cycle of the reactions), whereas a cut off <35 Ct was used to select reliably quantifiable miRNAs. RNU48 was used as an endogenous control. * p value < 0.0001.

