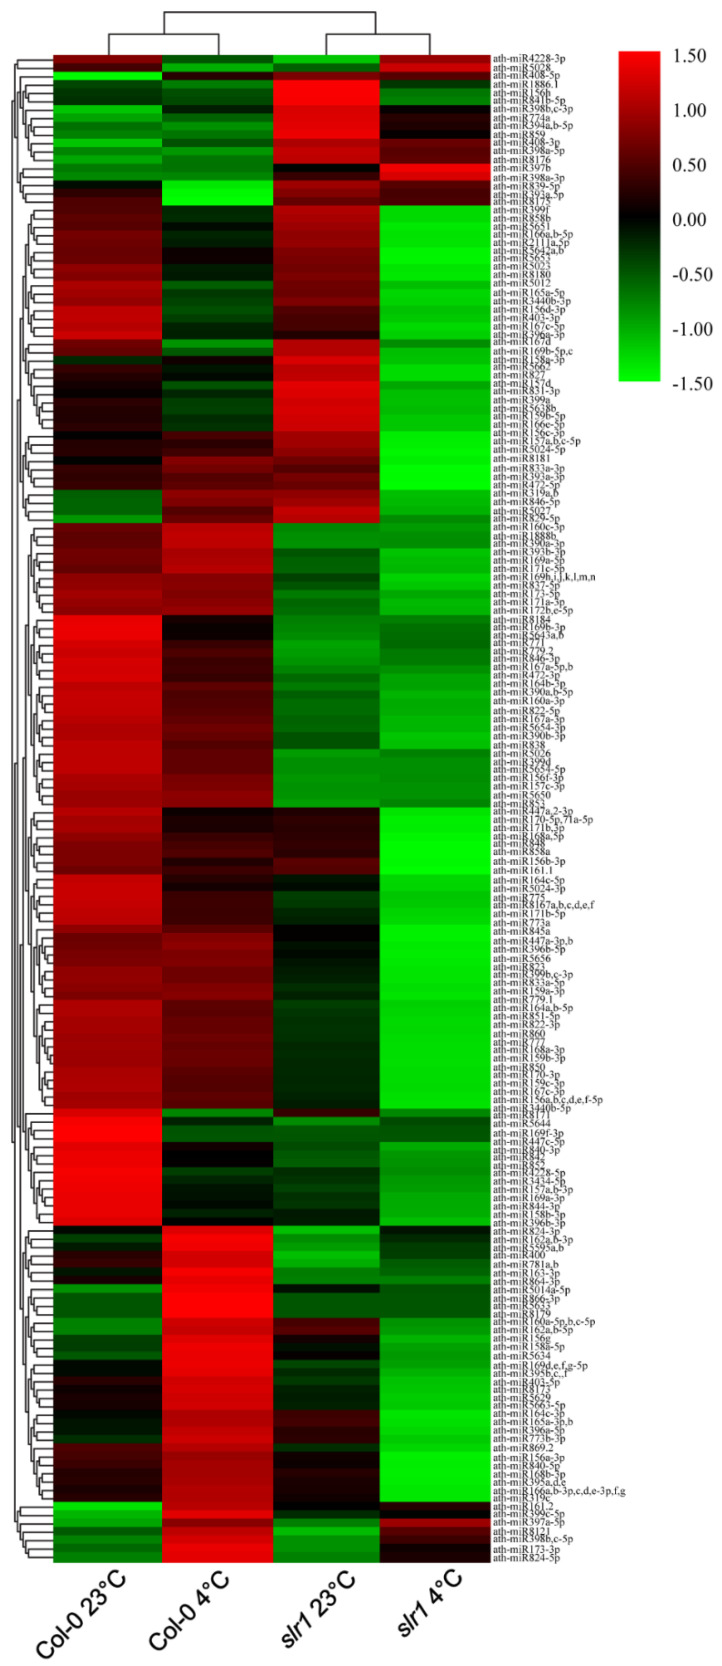
Figure 4.
Known miR expression profiles in the root of wild type (Col-0) and slr1. The heat map shows the hierarchical cluster analysis of miRs regulated in the cold-stressed root of wild type and slr1. The color bars of the heatmap represent the gradient scale of normalized log2-TPM values for each miR. Red color indicates a high level of miR abundance, and green color indicates low abundance. The analysis was performed using two independent biological replicates.

