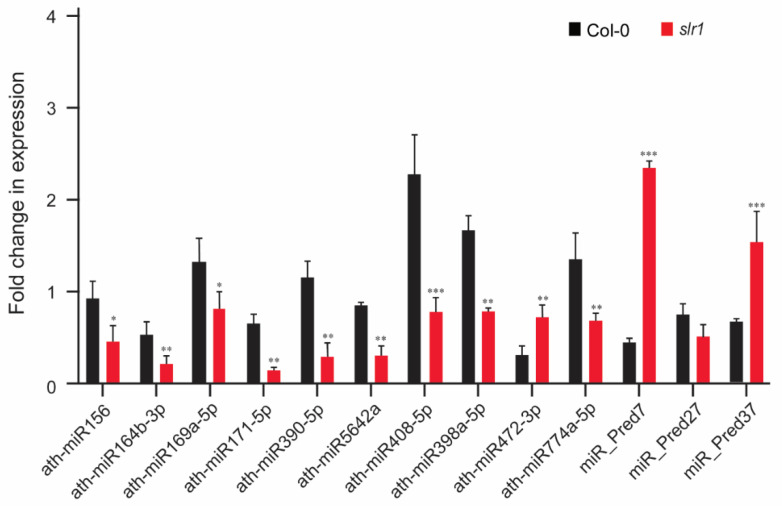
Figure 6.
Validation of miR expression in response to cold stress. RT-qPCR validation of selected miRs from cold stress NGS library. Vertical bars represent the mean ± SE of three biological replicates. Asterisks represent the statistical significance between control and treatment as judged by the Student’s t-test (* p < 0.05, ** p < 0.01, and *** p < 0.001).

