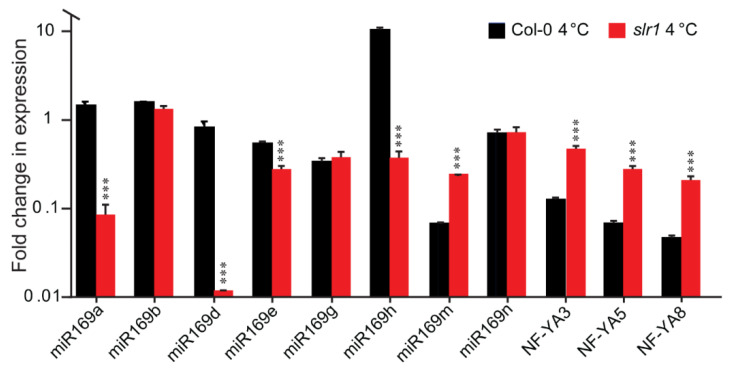
Figure 8.
Relative expression of miR169 precursors and NF-YA3, NF-YA5, and NF-YA8 in Col-0 and slr1 after 12 h of cold (4 °C) stress. Vertical bars represent the mean ± SE of three biological replicates. Asterisks denote the statistical significance between the Col-0 and slr1 at 4 °C as judged by the Student’s t-test (*** p < 0.001).

