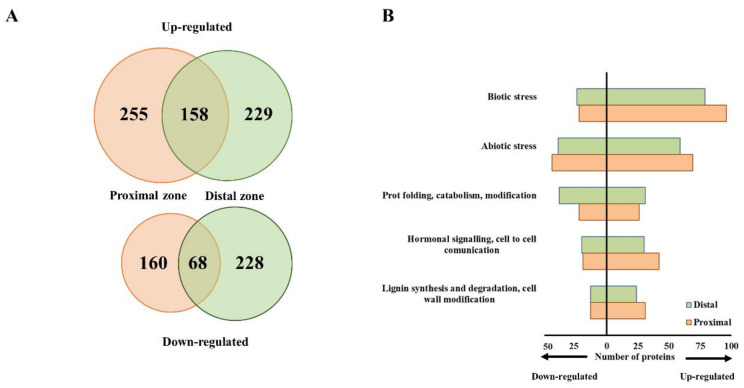
Figure 2.
Proteome rearrangement in chestnut stems infected with Phytophthora cinnamomi. (A) Venn diagrams depicting the overlap between proteins that accumulated (upper panel) or decreased (lower panel) in stem sections proximal and distal to the infection zone in comparison to mock-treated controls (∣FC∣ ≥ 2, p ≤ 0.05). (B) Top five most represented functional categories of differentially abundant proteins in proximal and distal stem sections upon P. cinnamomi attack. Bars represent number of accumulated (right side) or decreased (left side) proteins. Proteins were assigned to each functional category based on their putative Arabidopsis orthologs identified using the Uniprot database.

