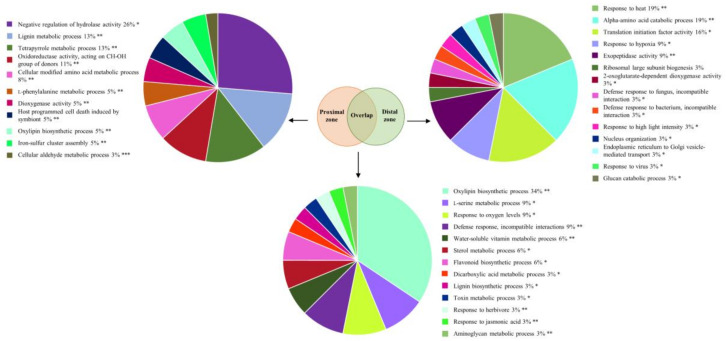
Figure 3.
Functional annotation enrichment of proteins that accumulated in chestnut stem after Phytophthora cinnamomi infection. Pie charts depict functional categories assigned by the Cytoscape ClueGO plug-in using Arabidopsis orthologs of chestnut proteins that accumulated exclusively in stem sections proximal (left panel) and distal (right panel) to the infection site or were similarly induced in both sections (lower panel). Numbers indicate percentage of terms per group and asterisks indicate group p-value (* p < 0.05; ** p < 0.01; *** p < 0.005).

