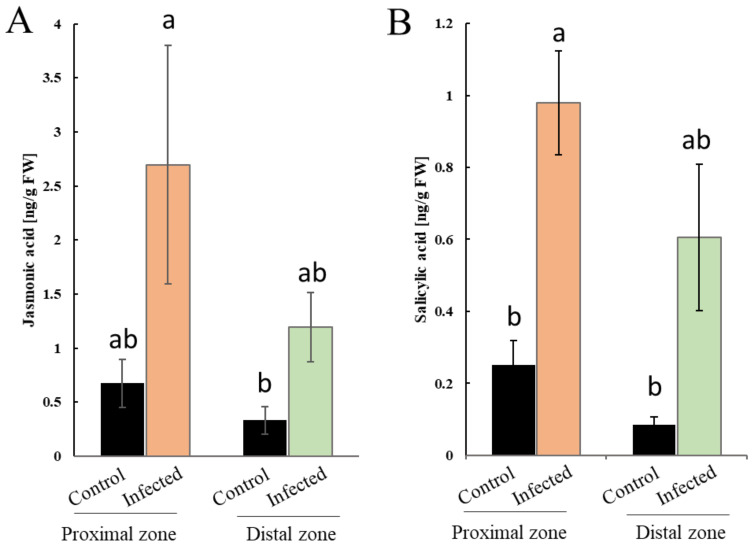
Figure 6.
Effect of P. cinnamomi infection on plant hormonal levels. (A) Jasmonic acid content in stem sections proximal (orange) and distal (green) to the necrotic area seven days after P. cinnamomi inoculation in comparison to mock-treated controls (black). (B) Salicylic acid content in stem sections proximal (orange) and distal (green) to the necrotic area seven days after P. cinnamomi inoculation in comparison to mock-treated controls (black). Bars represent averages of four biological replicates ± SE. Different letters depict statistical differences according to one-way analysis of variance (ANOVA) with Tukey’s post hoc test (p < 0.05).

