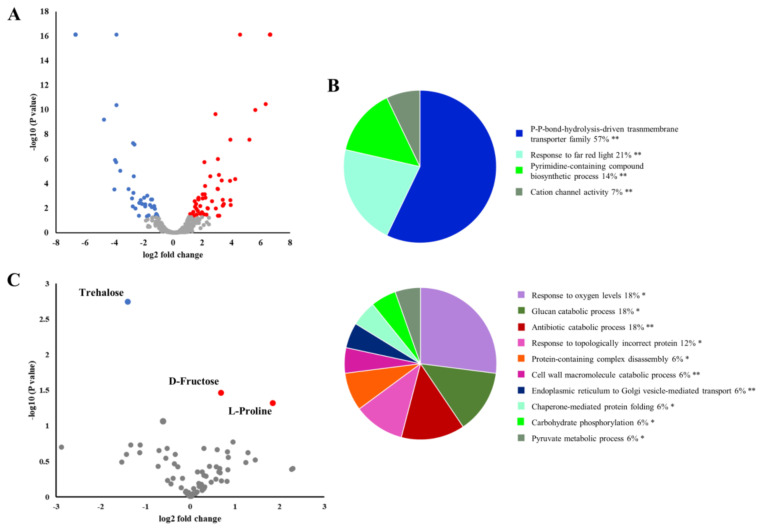
Figure 8.
Effect of Phytophthora cinnamomi stem infection on chestnut leaf proteome and metabolome. (A) Volcano plot of proteins upregulated (red) and downregulated (blue) in chestnut leaves seven days after stem inoculation with P. cinnamomi (log2 FC ≥ 1 and p ≤ 0.05). (B) Functional enrichment analysis based on Arabidopsis orthologs of chestnut proteins that accumulated (upper panel) or decreased (lower panel) in leaves of P. cinnamomi-inoculated chestnut plants after seven days performed using Cytoscape ClueGO plug-in. Numbers indicate percentage of terms per group and asterisks indicate group p-value (* p < 0.05; ** p < 0.01). (C) Volcano plot of the leaf metabolites with increased (red) and decreased (blue) concentration seven days after stem inoculation with P. cinnamomi (p value ≤ 0.05).

