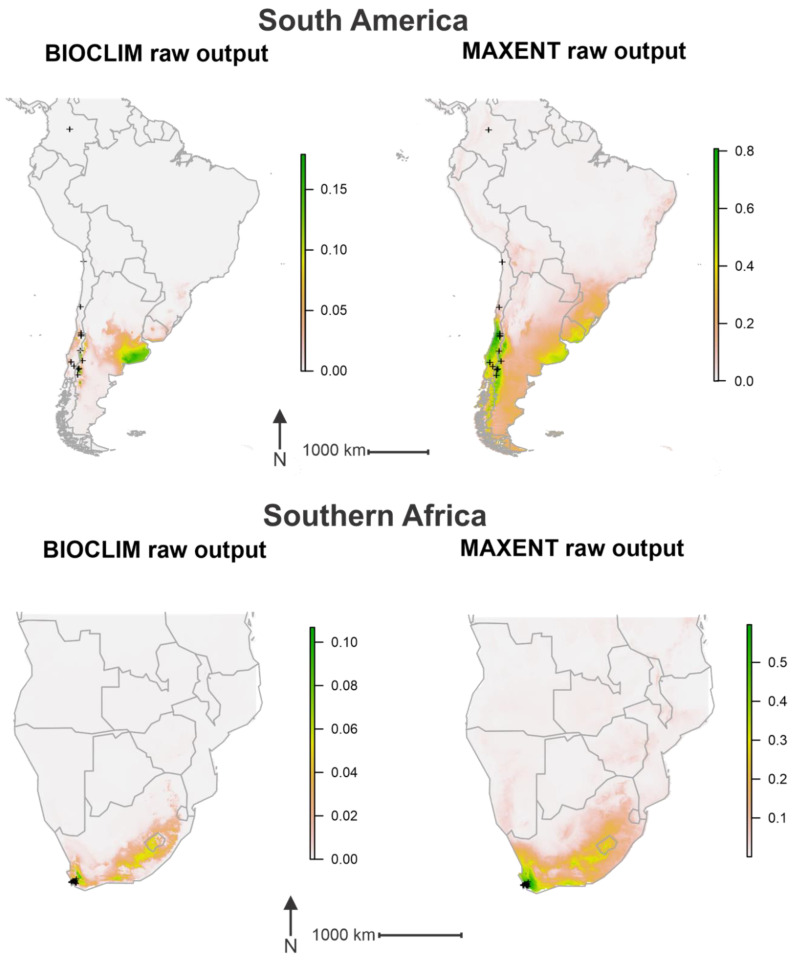
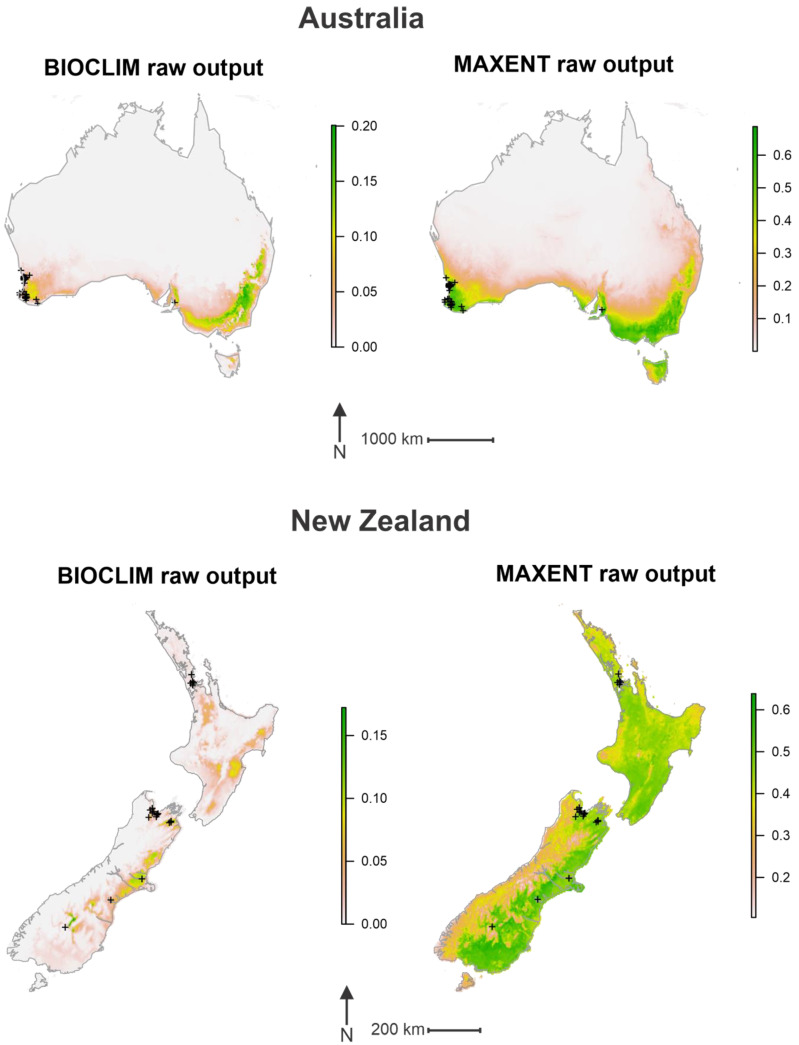
Figure 2.
Raw outputs of both prediction models. The left images show the raw output given by BIOCLIM. The raw output of the BIOCLIM prediction is a value between 0 and 1 where the higher the number the more suitable the environment is. The BIOCLIM algorithm compares the environmental values of a cell to the median values of the environmental values of cells containing known occurrences of the target species. Percentile scores closest to 0.5 are most suitable so values over this are subtracted from 1. The resulting score is multiplied by 2 to get a final value between 0 and 1 [30]. The right images show the raw output given by MAXENT where the value is an approximate probability that the species will be present given the local environmental conditions [31,46]. The black crosses indicate known occurrences of P. dominula.


