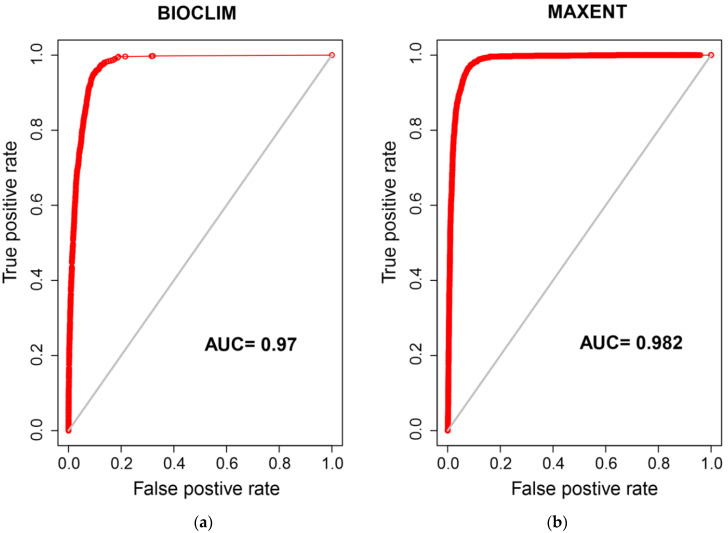
Figure 4.
Area under the receiver operating characteristic curve (AUC) plots for BIOCLIM prediction (a) and MAXENT prediction (b). This value is a number between zero and one and represents how accurately a model predicts presence/absence. A model with an AUC value of 1 predicts presence/absence with 100% accuracy while a model with an AUC score of 0.5 is one that predicts presence or absence correctly 50% of the time [30].

