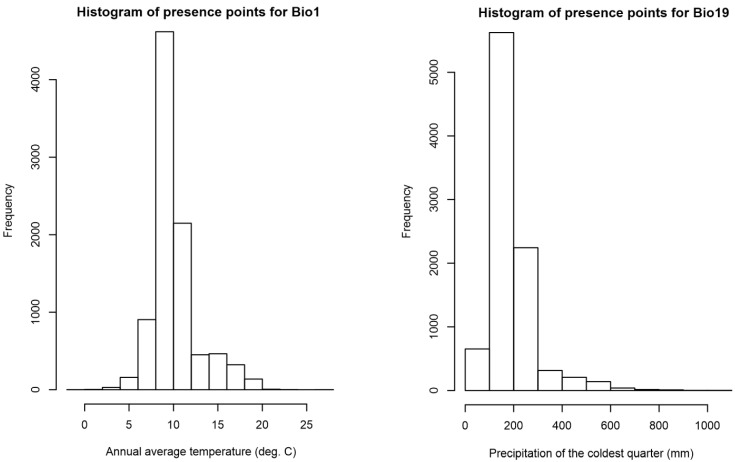
Figure 5.
Histograms showing the distribution of bioclimatic values at known occurrences of P. dominula. Left is the distribution of annual average temperature (Bio1) and on the right the distribution of precipitation of the coldest quarter (Bio19). These two variables were chosen from the full list of 15, based on their high permutation importance in the MAXENT modelling approach.

