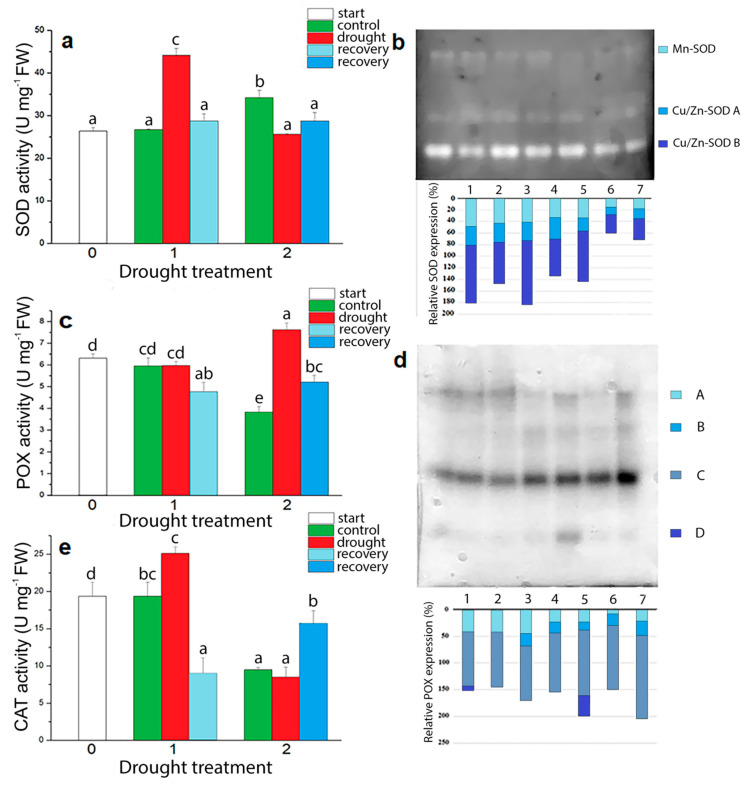
Figure 9.
(a) superoxide dismutase (SOD) activity; (b) SOD isoforms and their relative expression (%); (c) peroxidase (POX) activity; and (d) POX isoforms and their relative expression (%) and catalase (CAT) activity (e) in drought-stressed I. walleriana grown ex vitro. (a,c,e)—the “start point”, 15% and 5% of soil moisture content—0, 1 and 2, respectively; (d,e)—the “start point” (1), 15% of soil moisture content—control (2), drought (3), recovery (4) and 5% of soil moisture content—control (5), drought (6) and recovery (7). Results represent mean ± SE (n = 8). The letters indicate statistically significant differences based on the Fischer LSD test (p ≤ 0.05).

