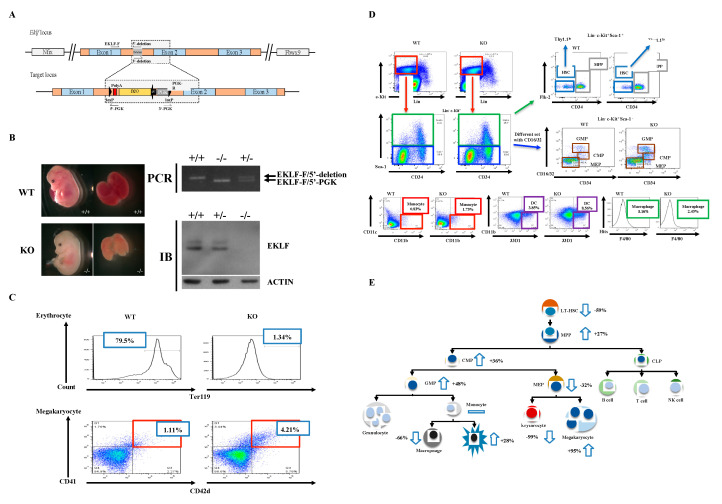
Figure 1.
Generation of mice with gene knockout (KO) of Eklf and population changes in the myeloid lineage cells in Eklf −/− E14.5 fetal liver. (A) Targeting strategy. The schematic diagram shows the genetic context of Eklf locus and the map of the targeting BAC construct harboring an inverted loxP-PGK-gb2-neo-loxP cassette in the intron 1 region of the Eklf gene. Note: neo, neomycin resistance gene; PGK, phosphoglycerate kinase I promoter; black arrow, the prokaryotic promoter gb2; black arrow heads, loxP sites. (B) Left panels, anemic phenotype of the homozygous Eklf −/− (KO) E14.5 embryo in comparison to the wild-type (WT) E14.5 embryo. Right upper two panels, genotyping of E14.5 embryos. Only a representative gel pattern of PCR using the primers EKLF-F/5′-deletion for wild-type and EKLF-F/5′-PGK for the mutant is shown here. +/+, wild-type; +/−, heterozygous Eklf +/−; −/−, homozygous Eklf −/−. Right lower two panels, immunoblotting (IB) analysis showing the depletion of EKLF protein expression by Eklf gene knockout. β-actin was used as an internal control. (C) Comparative fluorescence-activated cell sorter (FACS) analysis of erythrocytes and megakaryocytes in E14.5 fetal liver cells of the WT and Eklf −/− mice. Note the decrease in Ter119+ cells of erythroid lineage and increase in megakaryocytes in the Eklf −/− E14.5 fetal liver. n = 3. (D) FACS analysis using different combinations of antibodies to identify Flk2-CD34-hematopoietic stem cells (HSCs), the multipotent progenitor (MPP), common myeloid progenitor (CMP), granulocyte/macrophage progenitor (GMP), and myeloid/erythroid progenitor (MEP) in WT and Eklf −/− (KO) mouse E14.5 fetal liver. The differentiated cells were identified as the following: monocytes, dendritic cells, macrophages. The flow data for granulocytes are not shown here. n ≥ 6. The absolute number of cells per WT E14.5 fetal liver was approximately twice that of the KO E14.5 fetal liver (see Supplementary Table S1). (E) Cartoon chart showing the differentiation diagram of hematopoiesis and changes in the numbers of different types of hematopoietic cells in the KO fetal liver in comparison to the WT fetal liver. The change is defined as the increase (upward arrow) or decrease (downward arrow) in the average number of a specific type of blood cells in KO fetal liver relative to the WT fetal liver. For the absolute numbers per fetal liver of the different types of the cells, see Supplementary Table S1. n ≥ 6.

