Figure 2.
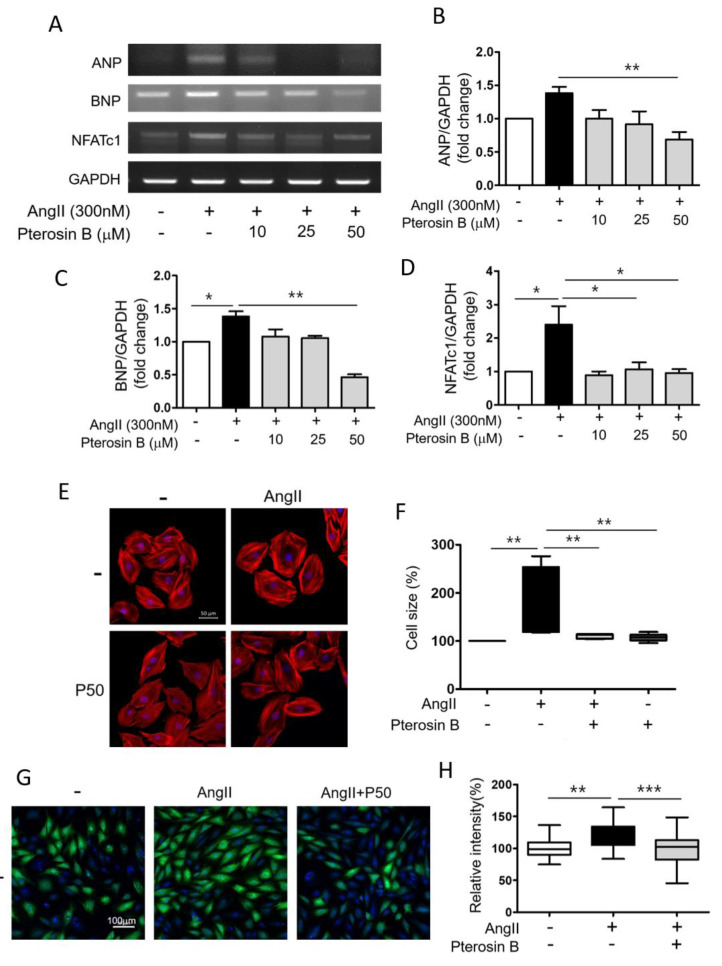
Anti-hypertrophic Effect of Pterosin B on Ang II-stimulated H9c2 cells. H9c2 cells were treated with 10–50 µM Pterosin B for 48 h in the presence of 300 nM ANG II. (A) Expression levels of cardiomyocyte hypertrophy-related mRNAs (ANP, BNP, and NFATc1) were estimated by reverse transcriptase PCR. (B–D) The ANP, BNP, and NFATc1 mRNA expression levels were normalized by GAPDH. * p < 0.05, ** p < 0.01. n = 3. (E) Texas-Red X-tagged phalloidin was stained for F-actin in H9c2 cells. Representative image was detected by confocal microscopy. P50 = Pterosin B (50 μM). Scale bar = 50 µm. (F) Average cell size was measured in each group and analyzed by Image J software. ** p < 0.01. n = 6. (G) Protein synthesis of H9c2 cells was determined using Click-iT® HPG Alexa Fluor® 488 Protein Synthesis Assay Kit. Green fluorescence indicates synthesis of new intracellular proteins and blue fluorescence (DAPI) indicates nucleus. P50 = Pterosin B (50 μM). Scale bar = 100 µm. (H) Quantification of the fluorescence intensity of protein synthesis. ** p < 0.01, *** p < 0.001. Scale bar = 100 µm. n = 4.

