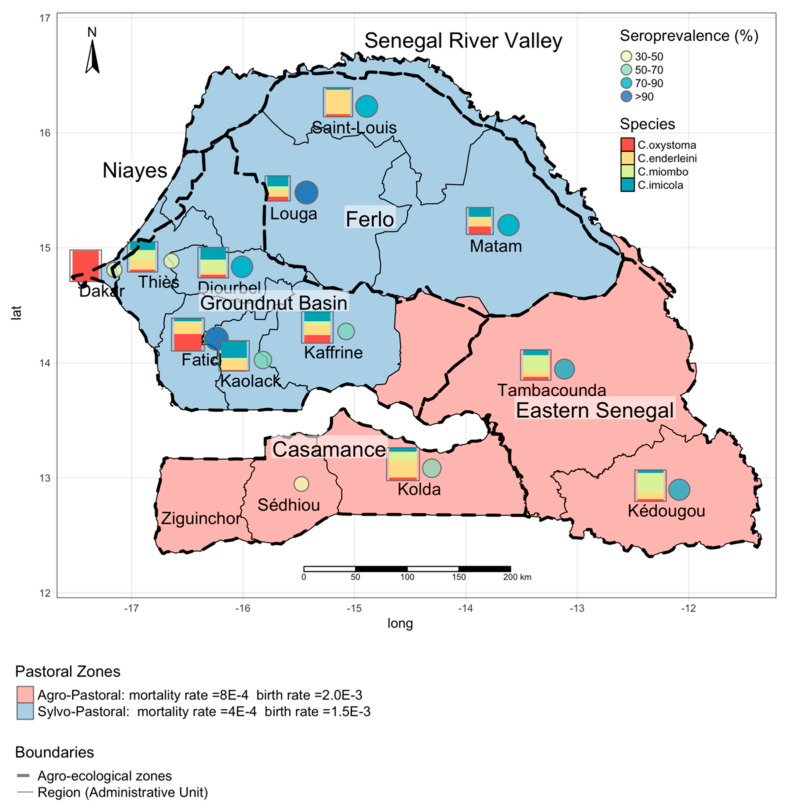
Figure 1.
Seroprevalence, entomological, and demographic data. The circles show regional BT seroprevalence based on data collected during the national sero-survey in 2018. The squares show the distribution of the four Culicoides species of interest; the square’s size is proportional to the logarithm of the number of Culicoides collected during the national entomological survey in 2012. The background colors (red and blue) delimit the two pastoral zones with different birth and mortality rates. Dashed lines delimit the six agro-ecological zones in Senegal (Ferlo, Senegal River Valley, Eastern Senegal, Casamance, Groundnut Basin, Niayes), while the thin solids lines identify the administrative regions.

