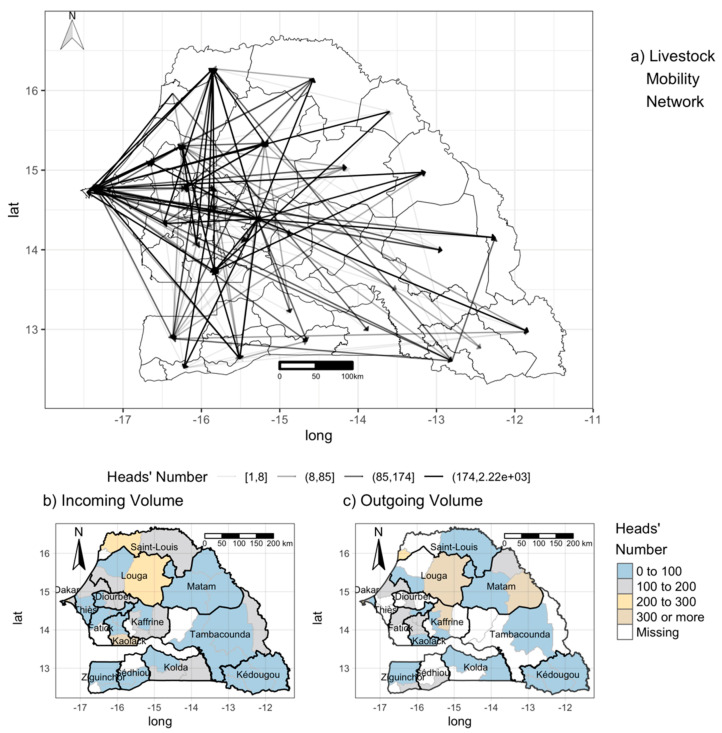
Figure 2.
Mobility data. On top (a) representation of livestock mobility network, each line corresponds to movements existing between the department, and the color is relative to the number of animals exchanged. The bottom part, departments are colored based on: (b) The incoming volume (number of animals arriving in the department); (c) outgoing volume (number of animals leaving the department), na: data not available.

