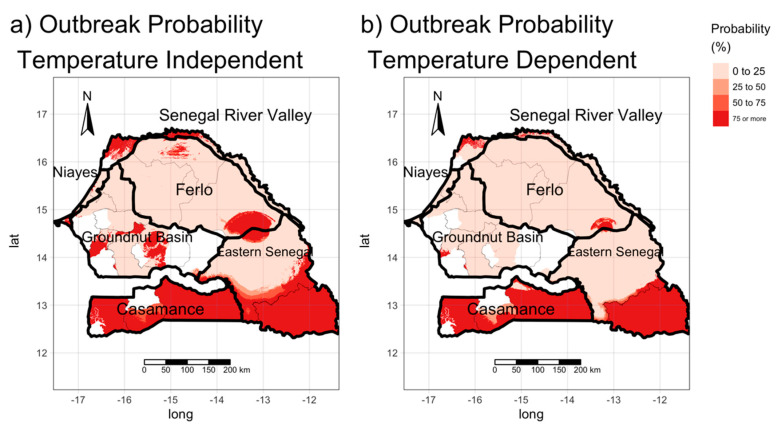
Figure 7.
Probability of outbreaks due to the introduction of infected animals. (a) using R0 temperature-independent values, (b) using R0 temperature-dependent values. Livestock movements from infected areas could explain why areas with a low value of R0 could have a high risk of outbreak occurrence. White areas correspond to areas where the outbreak probability has not been estimated because of missing information.

