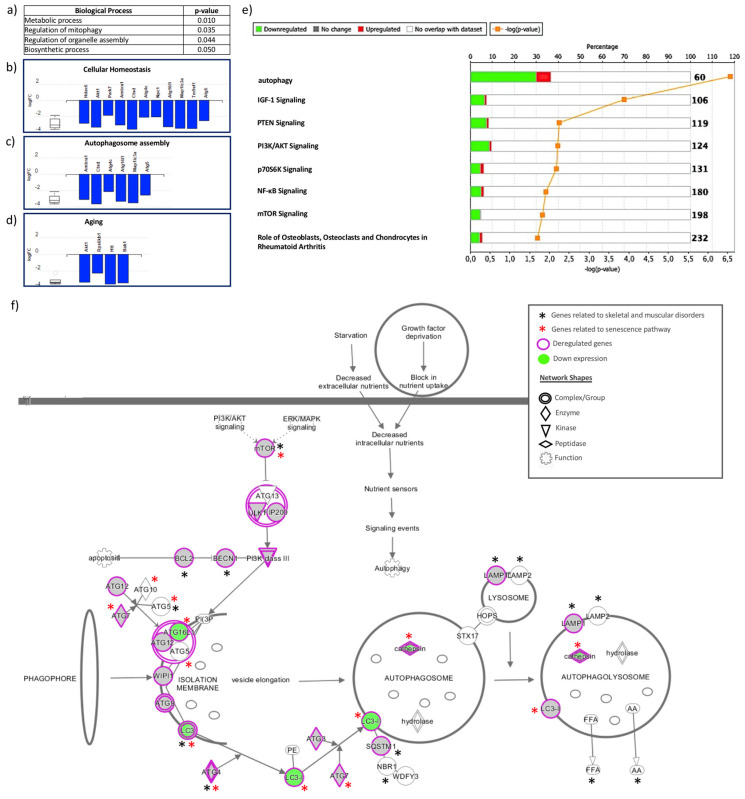
Figure 4.
Bioinformatics analysis of biological process terms and pathways among genes related to autophagy in order to explore the biological relevance of the deregulated genes. (a,d) Bioinformatics analysis with Advaita Bio’s iPathwayGuide. (a) Table for biological process terms that are significantly associated with deregulated genes. (b–d) Molecules and their respective fold changes involved in the processes of cellular homeostasis, autophagosome assembly, and aging, respectively. (e,f) Bioinformatics analysis with Ingenuity Pathway Analysis. (e) Pathways and diseases associated with differentially expressed genes. (f) Autophagy pathway, deregulated genes, and overlap with skeletal and muscular disorder and senescence. One of the general ways to activate autophagy begins with growth factor deprivation that blocks the nutrient uptake, and another is starvation that decreases the extracellular nutrients; both stimuli decrease the intracellular nutrients, activate nutrient sensors, and generate signaling events that empower autophagy. The detailed processes are illustrated. The upstream pathways are PI3K (phosphoinositide 3-kinase)/AKT (serine/threonine kinase) signaling and ERK/MAPK signaling, respectively, which are able to regulate mammalian target of rapamycin (mTOR) signaling, a key factor for autophagy. In general, autophagy consists of a series of dynamic membrane rearrangements mediated by a group of proteins related to ATG, where Atg1 (ULK1), Atg6 (Beclin1), Atg8 (LC3), and Atg5 are the 4 major regulators of the autophagy pathway. First, cytoplasmic sequestration is generated within double membrane vesicles called autophagosomes. Subsequently, these vesicles are fused with the lysosome to generate autolysosomes, which leads to the degradation of the cargo. It is important to highlight the association among autophagy, skeletal and muscular disorders, and senescence. The genes involved in skeletal and muscular disorders are shown with the black asterisks, and the genes related to senescence are shown with red asterisks.

