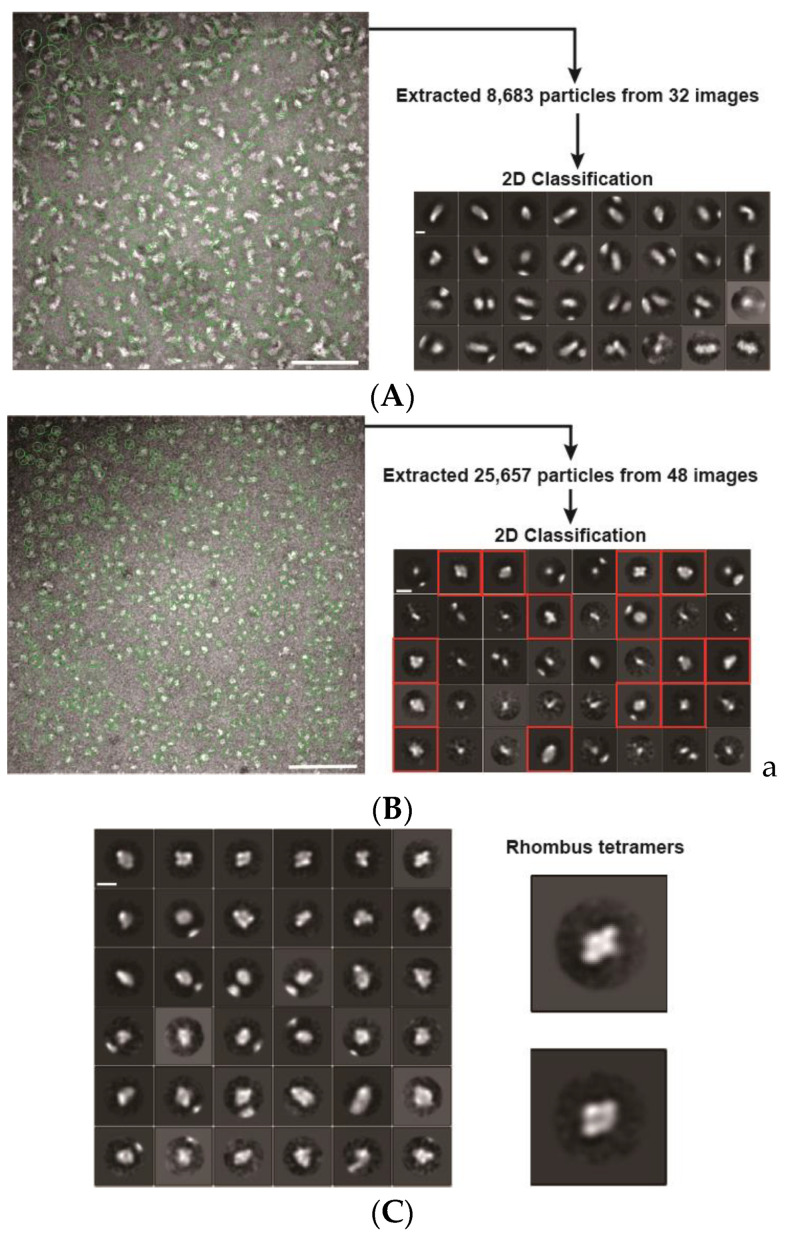
Figure 3.
Electron microscopy (EM) images and 2D classifications. (A) EM image and 2D classification of PfPV1-Strep; (B) EM image and 2D classification of rPfPV1-Strep; (C) second 2D classification of rPfPV1-Strep. A total of 9228 particles of red boxes of 2D classification in (B) were used. Enlarged images of rhombus tetramers are shown. Scale bars represent 100 nm in the original images and 10 nm in the enlarged images.

