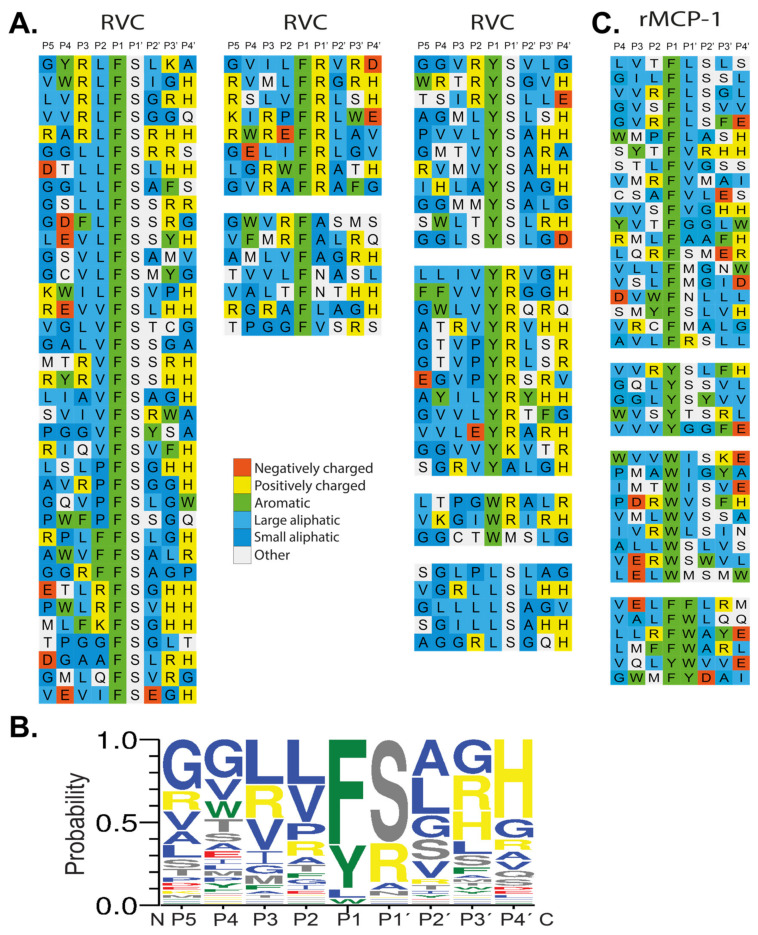
Figure 4.
(A) Phage display analysis of RVC and rMCP-1. After six selection rounds, plaques were picked and the random nonamer region (PGG(X)9HHHHHH, with X indicating randomized amino acids was amplified using PCR. The resulting sequences were aligned P5-P4’ with cleavage occurring between the P1 and P1’ positions. Amino acids are color coded according to their properties as indicated in the figure. (B) At the bottom of the figure, we show an Ice-Logo type presentation using the Web-logo program of the distribution of amino acids in positions P5 to P4’ based on the phage display alignment by RVC after six rounds of selection [33]. (C) Phage display sequences for rMCP-1 are shown for direct comparison with the sequences obtained for RVC. The phage display sequences for rMCP-1 originate from an earlier publication [22].

