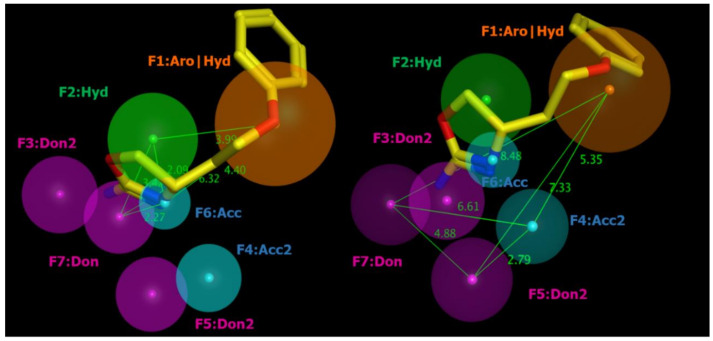
Figure 5.
Pharmacophore features shared by most of the oxazolines acting as hTAAR1 agonists (Table S1). The most potent derivative 20b is mapped onto the corresponding pharmacophore model (PM) features and is depicted by sticks (colors as in Figure 4). Distances between the main groups are shown as green lines and labelled (Å).

