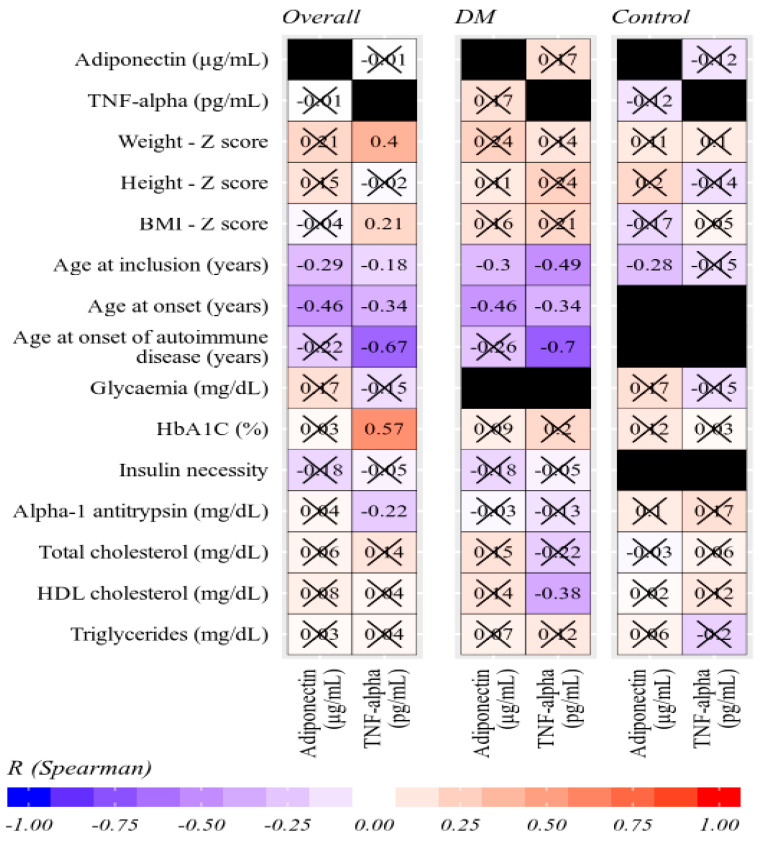
Figure 3.
Correlation between adiponectin and TNF-α (Spearman’s R coefficient). Reference values marked by dotted lines at 8.1 pg/mL for TNF-α and at 4, 7, and 10 μg/mL for adiponectin (Spearman’s R coefficients, statistically insignificant values crossed out, black boxes—parameters could not be corelated between the two groups).

