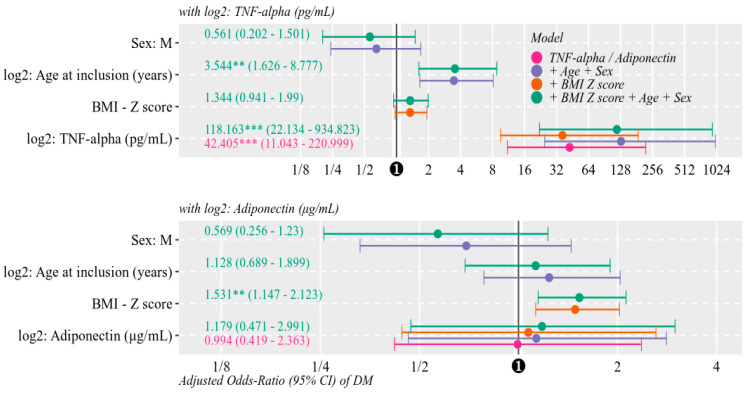
Figure 4.
Logistic models for odds-ratios of T1DM by adiponectin or TNF-α, unadjusted (purple) and adjusted for BMI Z score (orange), age at inclusion and gender (blue), and all three covariates combined (green). Adiponectin, TNF-α and age were transformed to base 2 logarithms, therefore odds ratios are referenced to every doubling of original values. (p-value = ⁺: <0.10, **: < 0.01, ***: <0.001).

