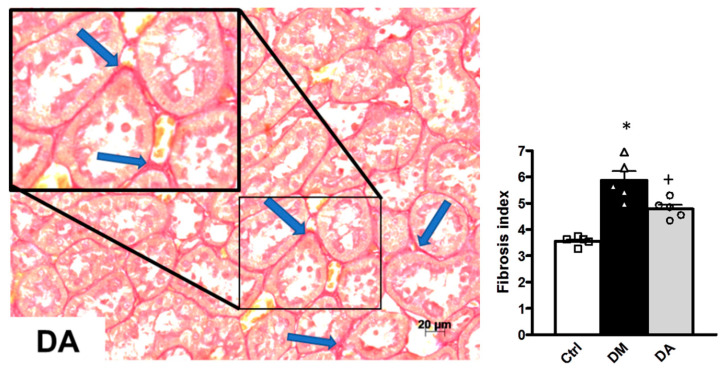
Figure 5.
Interstitial fibrosis and quantitative analysis of rat kidneys. Sirius Red for collagen staining (fibrosis) in red of kidney cortex sections, representative of each experimental group. Control (Ctrl) shows very thin red lines (arrows) separating the cortex tubules in a normal interstitium. Diabetes (DM) depicts a clear modest widening of the interstitium (arrows) in comparison with the control. Diabetes + Allicin (DA) photomicrograph allows the visualization of a near normal interstitium, with a few areas of a thicker space between tubules (arrows). Original magnification 200×. Graph shows quantitative analysis of interstitial fibrosis. Values are expressed as mean ± SEM of n = 5 * p < 0.001 vs. Ctrl; + p < 0.001 vs. DM.


