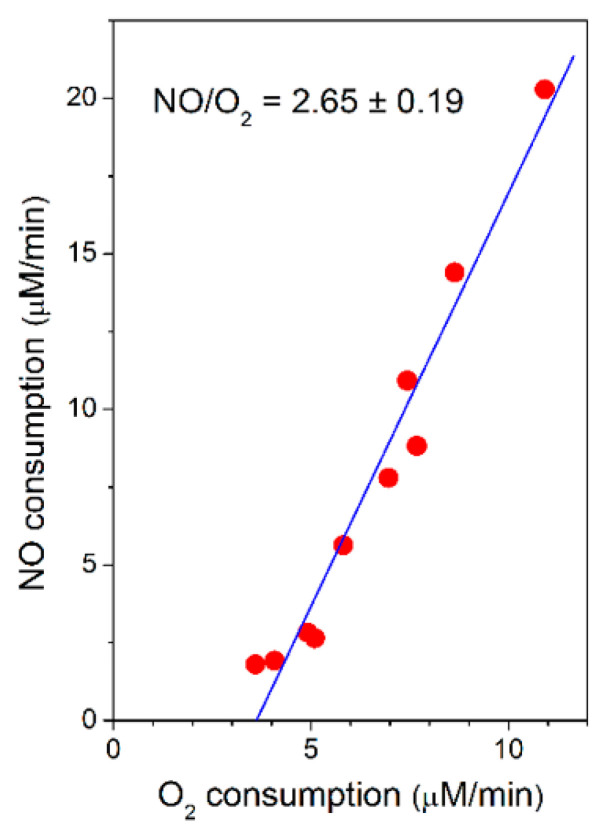
Figure 3.
Rate of NO consumption plotted as a function of the rate of O2 consumption by purified mycobacterial cytochrome bcc-aa3 supercomplex. NO (30 µM) was added to cytochrome bcc-aa3 in the presence of DTT (5 mM) and MD (0.26 mM) at [O2] ≈ 130 µM. Conditions as in Figure 1. Linear regression analysis (solid line) of experimental data points (red circles: NO consumption rate) gives a NO/O2 ratio of 2.65 ± 0.19 (mean ± standard deviation).

