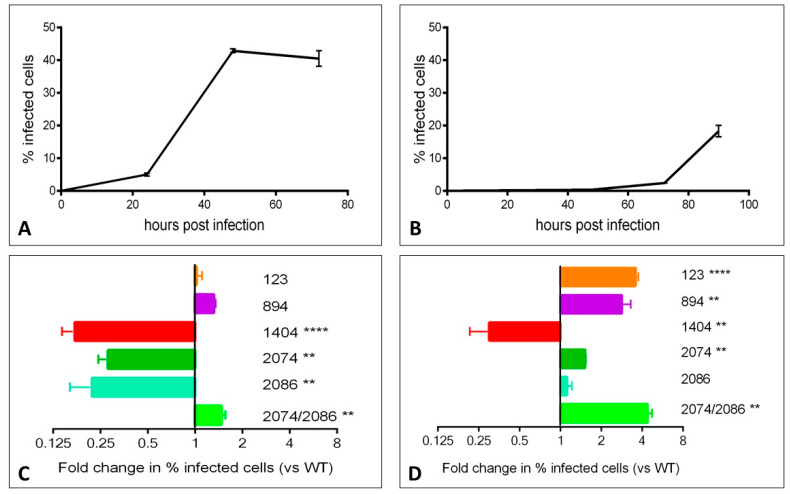
Figure 2.
Mutants display varying growth characteristics in Vero and C6/36 cell lines. Vero and C6/36 cell lines were infected with wild-type (WT) or indicated mutant viruses at a multiplicity of infection (MOI) of 0.01 (Vero) or 0.05 (C6/36) and harvested for FACS analysis at the indicated time points. Representative time course plots are shown for the WT virus in Vero cells (A) and C6/36 cells (B). The fold change in infected cells observed with each mutant relative to WT are shown at the 48 h time point for Vero cells (C) and at the 90 h time point for C6/36 cells (D). ** p < 0.01, **** p < 0.0001.

