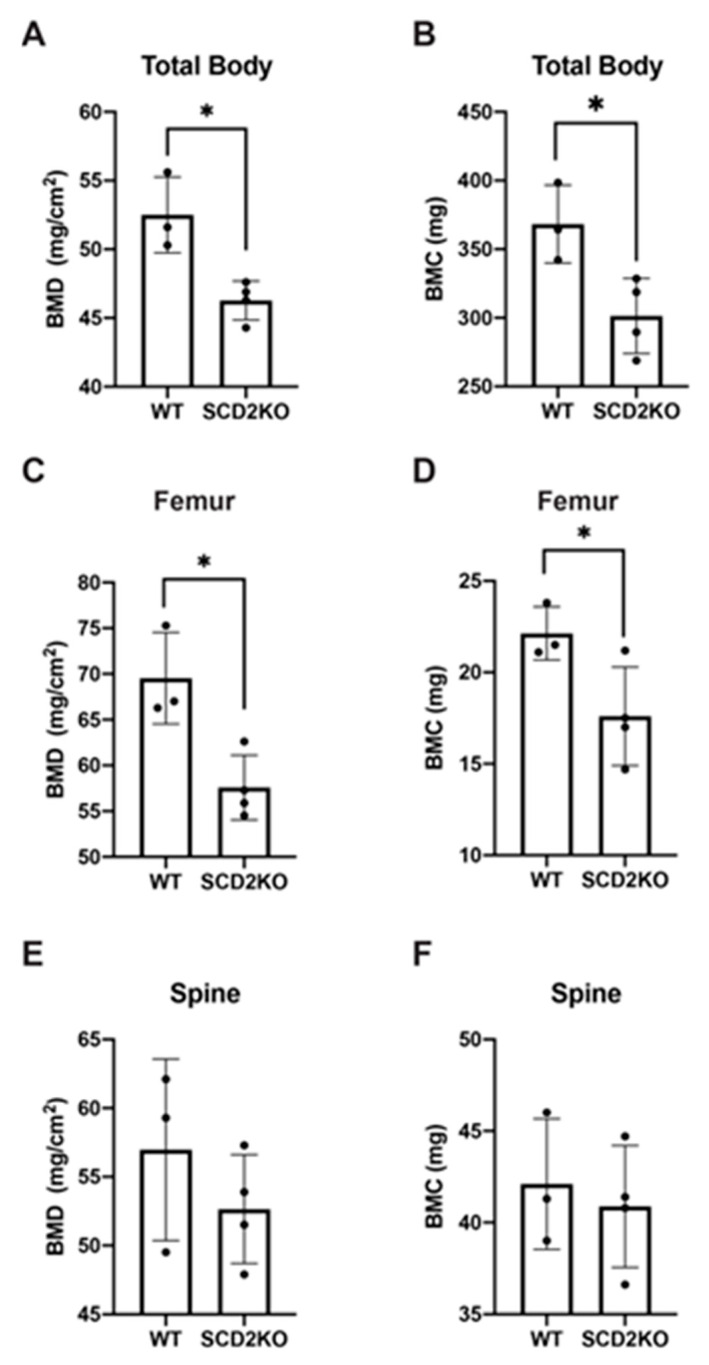
Figure 3.
SCD2KO mice have decreased bone mineral density (BMD) and bone mineral content (BMC). (A) Total BMD of male WT (n = 3) and SCD2KO (n = 4) mice, fed 10 weeks high-fat diet (HFD). (B) Total BMC of male WT (n = 3) and SCD2KO (n = 4) mice, fed 10 weeks HFD. (C) Femoral BMD of male WT (n = 3) and SCD2KO (n = 4) mice, fed 10 weeks HFD. (D) Femoral BMC of male WT (n = 3) and SCD2KO (n = 4) mice, fed 10 weeks HFD. (E) Spinal BMD of male WT (n = 3) and SCD2KO (n = 4) mice, fed 10 weeks HFD. (F) Spinal BMC of male WT (n = 3) and SCD2KO (n = 4) mice, fed 10 weeks HFD. Values are mean ± SD, * p < 0.05 vs. WT by Student′s two-tailed t-test. Dots represent individual values.

