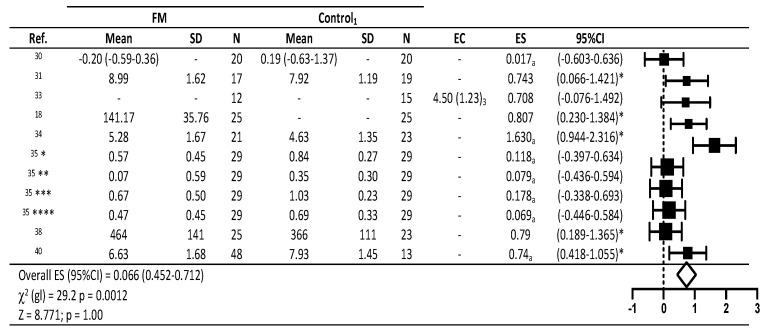
Figure 2.
Descriptive statistics and forest plot of effects of fibromyalgia treatment interventions on cortisol levels. CS = contrast statistic; 1: comparison group, other treatment applied; 2: median (min-max) percentage change; 3: F (gl): Snedecor contrast F statistic (degrees of freedom); a: η2: Eta squared; 5: all measures; η2 as proposed by Cohen: <0.06 small, ≥0.06 to <0.14 medium and ≥0.14 large [28]; * = p < 0.05 in the original study analyzed; ES: effect sizes as proposed by Cohen: <0.2 small, ≥0.5 to <0.8 medium and ≥0.8 large28. 35 * = Sample 1: 35 ** = Sample 2; 35 *** = Sample 3: 35 **** = Sample 4 (Salivary cortisol samples during the late afternoon, before and after dinner, in the evening, and at bedtime).

