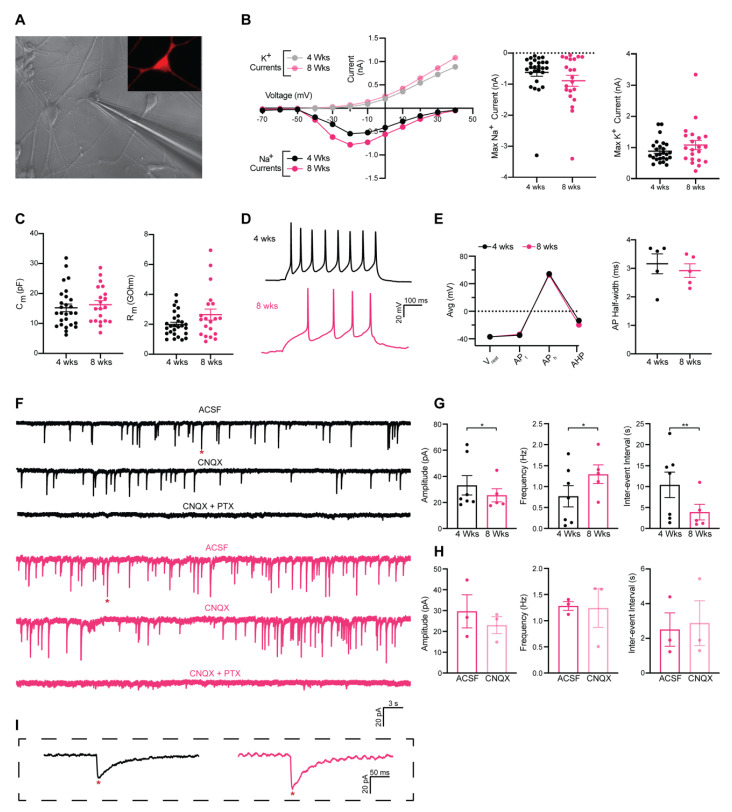
Figure 3.
Physiological properties of iNs converted with ADLSF at four weeks and eight weeks. (A) Representative image of Syn-RFP+ cell in whole cell patch-clamp configuration. (B) Inward Na+ and outward K+ currents plotted against stepwise voltage induction at four weeks (4 wks, black/grey) and eight weeks (8 wks, magenta/pink). Each dot representing the mean value (n = 26 cells, 4 wks and n = 21 cells, 8 wks). (C) Measured intrinsic membrane properties, input resistance (left) and membrane capacitance (right). All values are presented as mean ± SEM (n = 27 cells, 4 wks and n = 20 cells, 8 wks). (D) Representative trace of repetitive action potentials (APs) evoked by rheobase current injection steps, 4 wks (black) 8 wks (magenta). (E) AP properties, resting membrane potential (Vrest), AP threshold (APt) AP amplitude (APh) and after-hyperpolarization (AHP, left). Each dot representing the mean value (n = 5 cells, 4 wks and n = 5 cells, 8 wks). Half-width of the first evoked AP (right). Values are presented as mean ± SEM (n = 5 cells, 4 wks and n = 5 cells, 8 wks). (F) Sample traces of postsynaptic activity blocked with 50 µM CNQX and 50 µM CNQX + 100 µM PTX at 4 wks (black) and 8 wks (magenta). (G) Amplitude, frequency, and interevent interval of postsynaptic activity at 4 wks and 8 wks. Values are mean ± SEM (n = 7 cells, 4 wks and n = 5 cells, 8 wks). (H) Amplitude, frequency, and interevent interval of postsynaptic activity at 8 wks ACSF and ACSF + 50 µM CNQX. Values are presented as mean ± SEM (n = 3 cells). (I) Magnification of representative inhibitory postsynaptic events (red asterisk) at four weeks (black) and eight weeks (magenta). Two-tailed, unpaired Mann–Whitney (** p < 0.01; * p < 0.05) was used for all comparisons except postsynaptic activity with antagonist (CNQX), where paired Wilcoxon rank-sum tests were performed. See also Figure S2.

