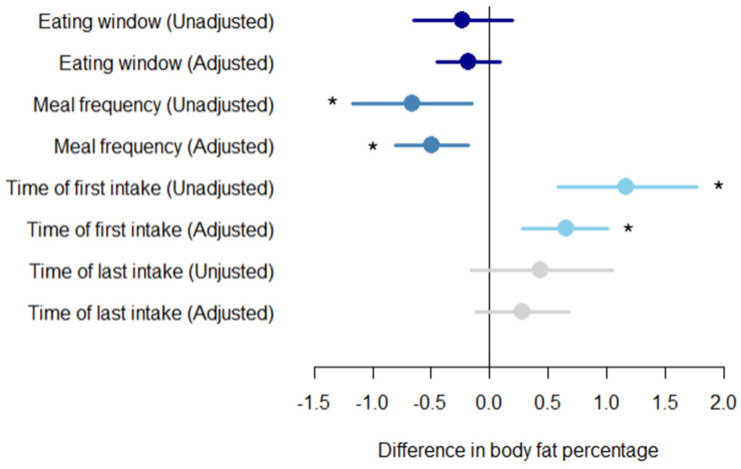
Figure 4.
Daily eating patterns and body fat percentage. Associations between body fat percentage for each increment in exposures for different daily eating patterns including daily eating window, meal frequency, time of first intake and time of last intake. The analysis is unadjusted and adjusted for age, gender, and total daily energy intake. An increment in daily eating window is one hour. An increment in meal frequency is one meal. An increment in time of first intake and last intake is one hour. The circles represent effect sizes; extended lines show 95% confidence intervals. * p-value < 0.05.

