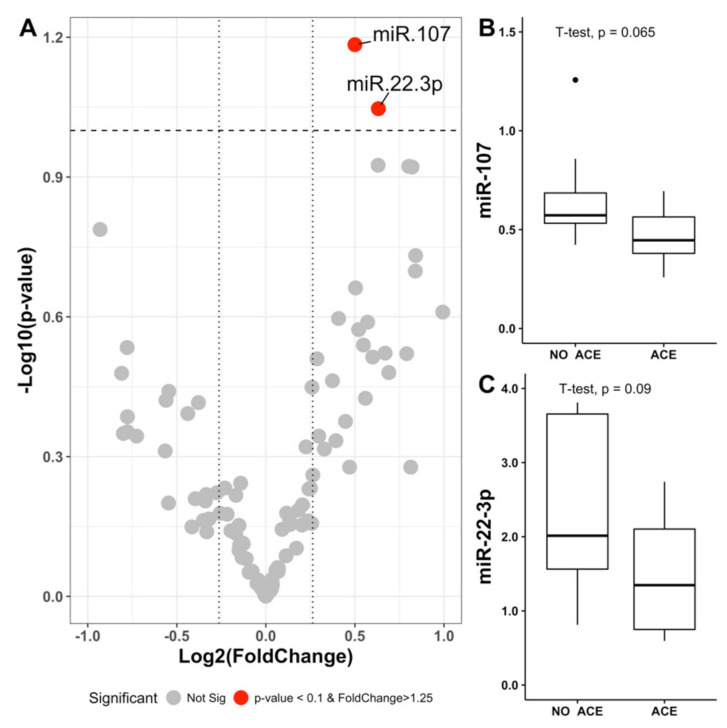
Figure 1.
Levels and selection of miRNAs in the pilot study. (A) Volcano plot representing the fold change values in logarithm of base 2 (X-axis) and the p-values in logarithm of base 10 (Y-axis). (B,C) Box plots representing the miRNA levels selected for meeting the criteria of p-value less than 0.1 and fold change greater than 1.25. ACE = adverse cardiovascular events.

