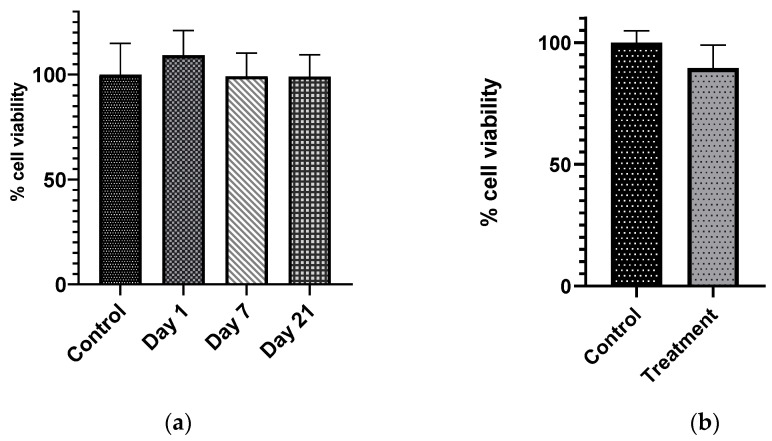
Figure 4.
(a) There was no significant decrease in the cell viability of MG63 cells when the cells were exposed to different drug release samples from different time points, day = 1, 7, and 21 (α = 0.05, n = 4), compared to the control cell receiving only phosphate buffered saline. (b) When the drug was released from ABVF placed inside transwell inserts, the treatment cells did not show any significant difference compared to the control cell (α = 0.05, n = 3).

