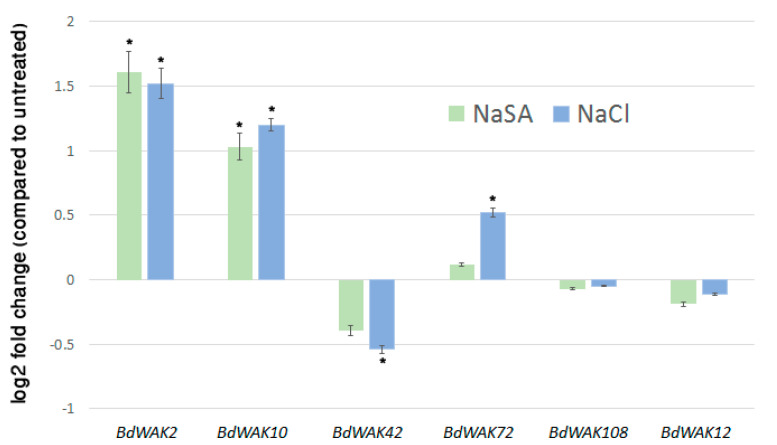
Figure 3.
Transcript levels of selected BdWAK genes as determined by qPCR in B. distachyon seedlings in response to 0.5 mM NaSA (green) and 250 mM NaCl (blue) treatment. Data shown as log2 fold change relative to untreated control. Each measurement was performed in triplicate, with three biological replicates. Expression levels normalised to reference genes listed in Table S1. Asterisk indicates ∆CT values that were significantly different between treated (NaSA or NaCl) and untreated sample (Student’s t-test, p < 0.05). Error bars indicate standard error.

