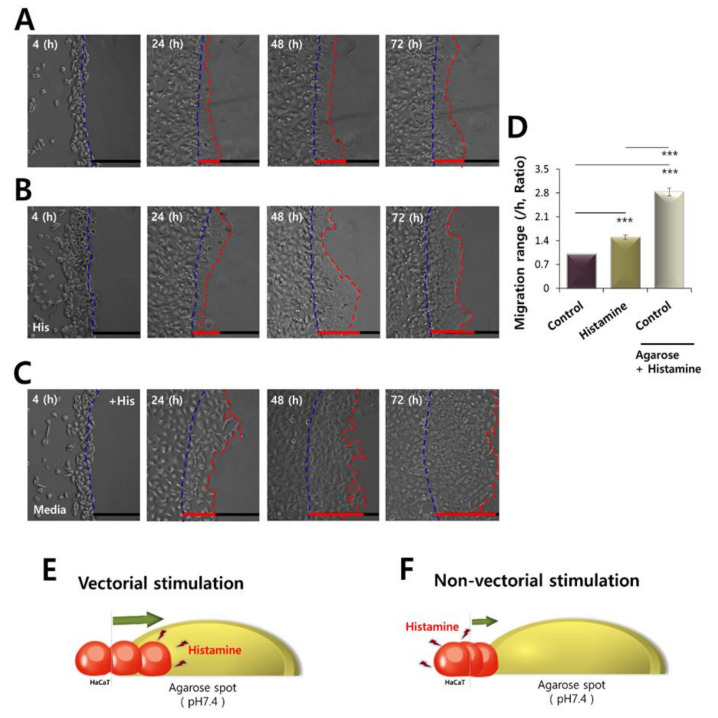
Figure 5.
Motility of HaCaT cells was driven more by vectorial chemotaxis. Time dependent representative images of HaCaT keratinocytes migrating (4, 24, 48, and 72 h) towards agarose spots (A) in PBS (pH7.4)-containing agarose spots, (B) in the presence of 500 nM His-containing media and in PBS (pH7.4)-containing agarose spots, and (C) in the 500 nM His-containing agarose spots. The direction of migration across the boundary of the agarose spot is shown as a dashed curve (blue dotted lines). The red dotted lines indicate the lineage of keratinocytes that moved into the spots. (D) Analysis of migration range per hour in agarose spots in the absence or presence of 500 nM His. Bars indicate the means ± SEM of the number of experiments (*** p < 0.001, n = 4). (E) Schematic illustration of the vectorial stimulation toward the histamine-containing agarose spot. (F) Schematic illustration of non-vectorial stimulation of histamine-containing media toward the agarose spot.

