Figure 6.
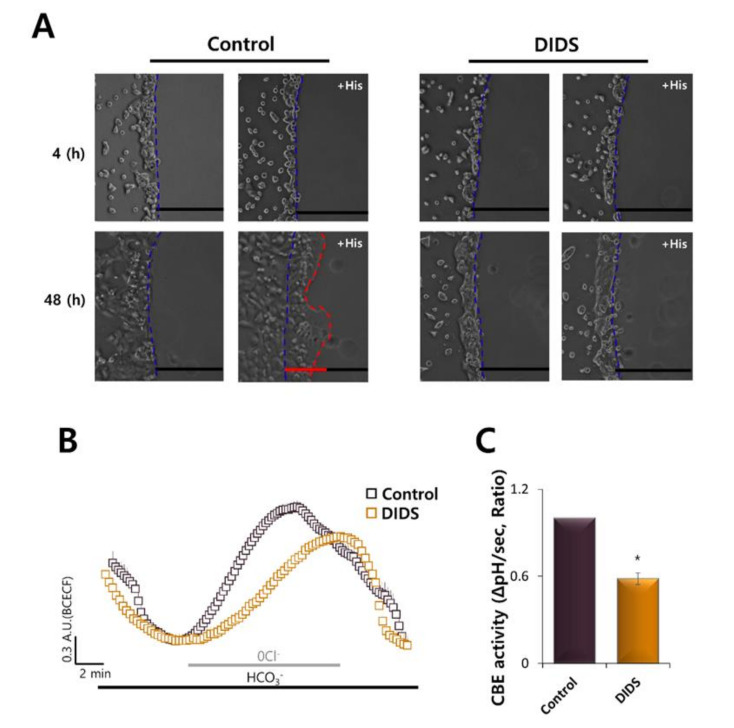
Inhibition of transporters by DIDS attenuated HaCaT migration. (A) Time-dependent representative images of HaCaT keratinocytes migrating (4 and 48 h) towards agarose spots containing PBS (pH 7.4) with and without 500 nM His and in the absence or presence of 500 μM DIDS-containing media. The direction of migration across the boundary of the agarose spot is shown as a dashed curve (blue dotted lines). The red dotted lines indicate the lineage of keratinocytes that moved into the spots. (B) CBE activity of HaCaT keratinocytes with 500 μM DIDS (orange open square) and without (control, black open square) at 48 h. Averaged traces were represented. (C) Analysis of CBE activity. Bars indicate the means ± SEM of the number of experiments (* p < 0.05, n = 3).

