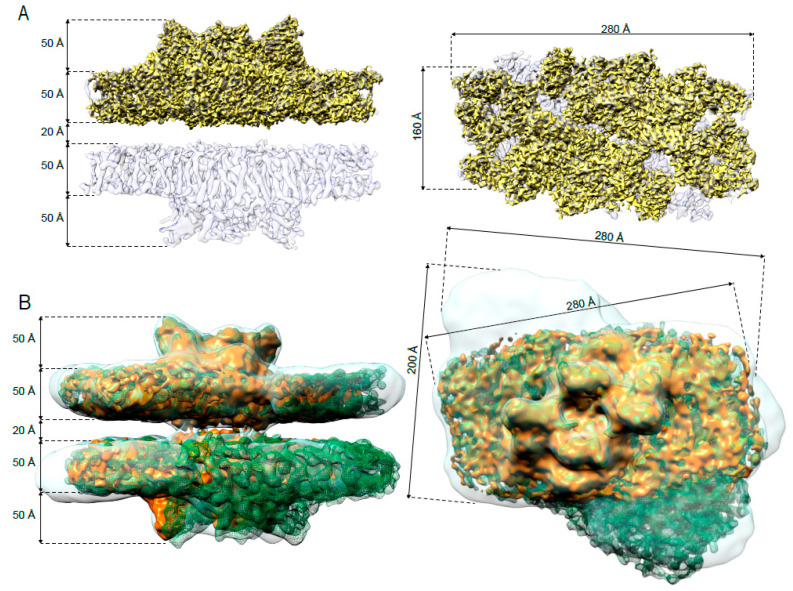
Figure 1.
Comparison of the main representative paired PSII-LHCII supercomplexes isolated from plants grown in high-light and low-light. (A) Cryo-EM density map of the (C2S2)2-H at 6.5 Å (light violet) with embedded the cryo-EM density map of the C2S2-H at 3.8 Å (yellow). (B) Overlay of the cryo-EM density maps of the (C2S2)2-H at 8.4 Å (orange), (C2S2M)2-H at 11 Å (green mesh) and (C2S2M2)2-L at 13.1 Å (transparent light blue). In both panels, the side view (on the left) is along the membrane plane; the top view (on the right) shows the PSII from the lumenal side, normal to the membrane plane.

