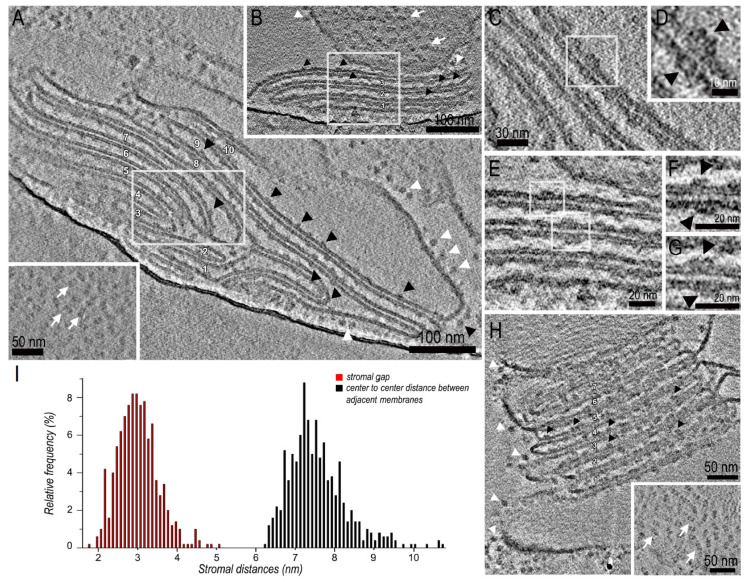
Figure 2.
Cryo-electron tomography of isolated stacked thylakoid membranes. (A) Average tomographic slice of a stack of 10 thylakoid membranes in side view. The inset shows a tangential averaged tomographic view of a thylakoid membrane. (B) Higher magnification of the boxed region in A in a slightly different tomographic section. (C) Higher magnification of the boxed region in B showing a paired PSII-LHCII supercomplex in two adjacent thylakoid membranes. (D) Average tomographic slice of a stack of 3 thylakoid membranes in side view. (E) Higher magnification of the boxed region in (D,F,G) are higher magnifications of the boxed regions in E showing paired PSII-LHCII supercomplexes in two adjacent thylakoid membranes. (H) Average tomographic slice of a stack of 7 thylakoid membranes in side view. The inset shows a tangential averaged tomographic view of a thylakoid membrane. (I) Distributions of stromal gap (red) and center-to-center distances (black) between adjacent thylakoid membranes across the stromal gap. In the figure, white and black arrowheads point respectively to the ATP-synthase complexes protruding from the grana end membranes and to the extrinsic subunits of PSII protruding into the lumen; white arrows point to PSII-LHCII supercomplexes.

