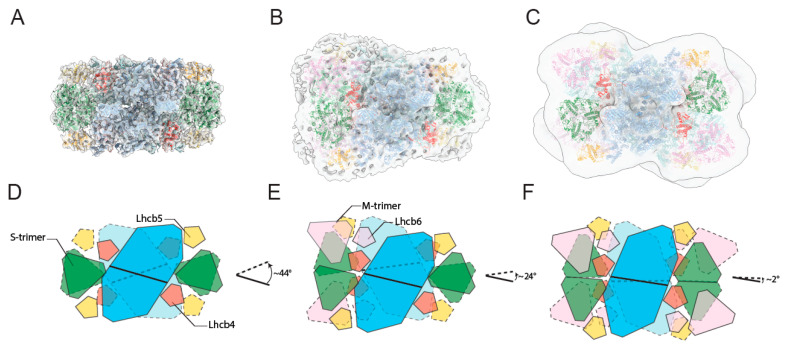
Figure 4.
Cryo-EM density maps of paired PSII-LHCII supercomplexes with different antenna size isolated from plants grown in high-light and low-light. Top view towards the lumenal surface of the 3D maps of the supercomplexes (C2S2)2-H at 6.5 Å (A), (C2S2M)2-H at 11 Å (B), (C2S2M2)2-L at 13.1 Å (C), fitted with high-resolution structures (PDB: 5XNL devoid of one LHCII-M trimer and one Lhcb6 in panel (B); PDB: 5XNL in panel (C)) [22], and corresponding schematic representations (D–F) showing the positions of all fitted supercomplex components and rotational offsets measured between the plane perpendicular to the axis of symmetry of the PSII dimeric core of the lower supercomplex with respect to its counterpart of the upper supercomplex. Subunits coloured as follows: PSII dimer in cyan, LHCII-S trimer in green, Lhcb4 in red, Lhcb5 in orange, LHCII M-trimer and Lhcb6 in pink (dark colours for upper supercomplex, light colours for lower supercomplex). In the scheme, colours match the structures of panels (A–C); solid lines for upper supercomplex, dashed lines for lower supercomplex.

