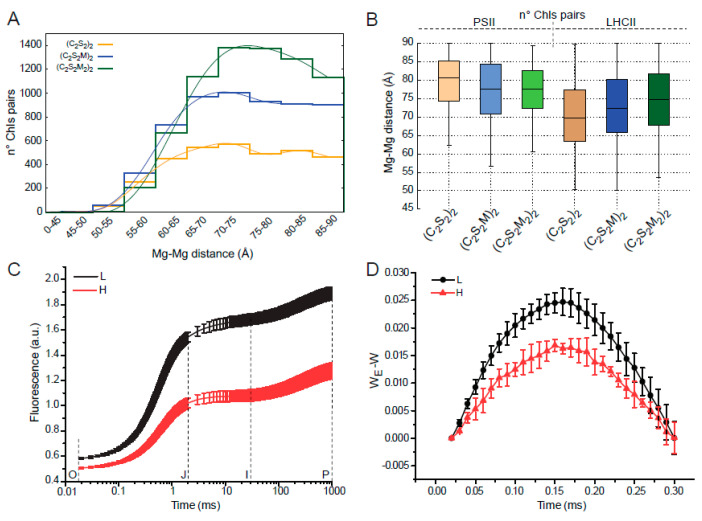
Figure 5.
Distance distribution of stromal chlorophylls pairs and PSII excitonic connectivity in paired PSII-LHCII supercomplexes with different antenna size. (A) Distribution of Mg-Mg distances calculated for Chls pairs made by a stromal Chl of the upper supercomplex and a stromal Chl of the lower supercomplex within a cut-off of 90 Å and (B) corresponding box-plot highlighting the contribution of the Chls pairs, belonging exclusively to PSII cores (left) or LHCII antennae (right), in paired PSII-LHCII supercomplexes of different antenna size. (C) Chlorophyll a fluorescence induction curves (i.e., the OJIP transient) plotted on a logarithmic time scale for paired PSII-LHCII supercomplexes isolated from H and L samples. (D) Estimated PSII energetic connectivity as plot of (WE—W), where W and WE (shown in Figure S5A) correspond respectively to the normalized O–J phase of the experimental OJIP curve and of the theoretical exponential curve corresponding to the unconnected system (for calculation of W and WE, see Figure S5D). Graphs in panels C-D display the mean values ± standard deviations of six replicates.

