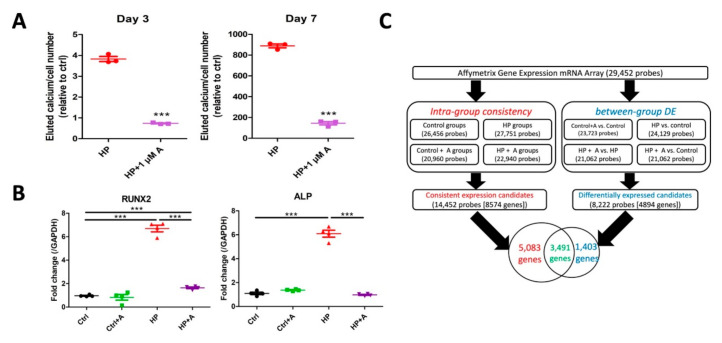
Figure 2.
Microarray experiments and the bioinformatic workflow. (A) Quantitation of calcification in cells subjected to HP and HP + astaxanthin at day 3 (left) and 7 (right). (B) Osteoblastic differentiation genes’ (left, RUNX2; right, alkaline phosphatase (ALP)) expression levels in cells undergoing different treatments. (C) The algorithm of sequentially analyzing transcriptomic data generated from Affymetrix microarray experiments. *** p < 0.001 compared with the reference group; A, astaxanthin; Ctrl, control; DE, differential expression; HP, high phosphate.

