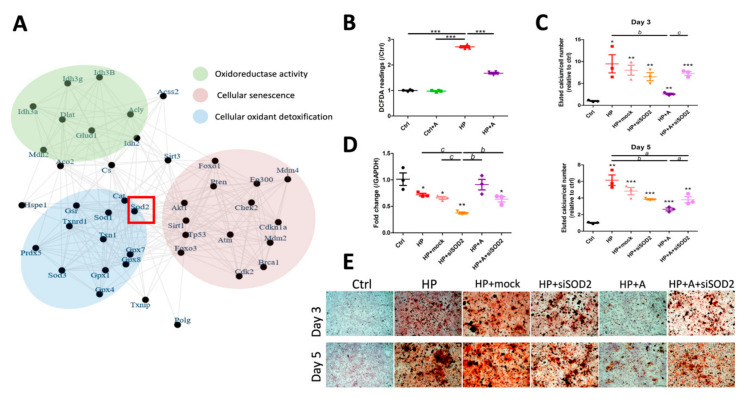
Figure 6.
Functional characterization of SOD2. (A) A node plot illustrating the interactions between SOD2 and potential effector pathways, divided according to the different spectrum of biologic processes. Red square denoted the validated core hub genes, SOD2. (B) VSMC ROS amount depending upon control or HP media with and without astaxanthin treatment. (C) Quantitation of calcification in SOD2 wild type or silenced cells with and without HP or astaxanthin exposure. (D) SOD2 mRNA expression levels and (E) microscopic examination images in each group. Scale bar, 200 μm. * p < 0.05, ** p < 0.01, and *** p < 0.001 compared with Ctrl or the reference group; a p < 0.05, b p < 0.01, and c p < 0.001 for comparison. A, astaxanthin; Ctrl, control; DCFDA, 2′,7′-dichlorofluorescin diacetate; HP, high phosphate; ROS, reactive oxygen species; siSOD2, SOD2 silenced group; VSMC, vascular smooth muscle cell.

