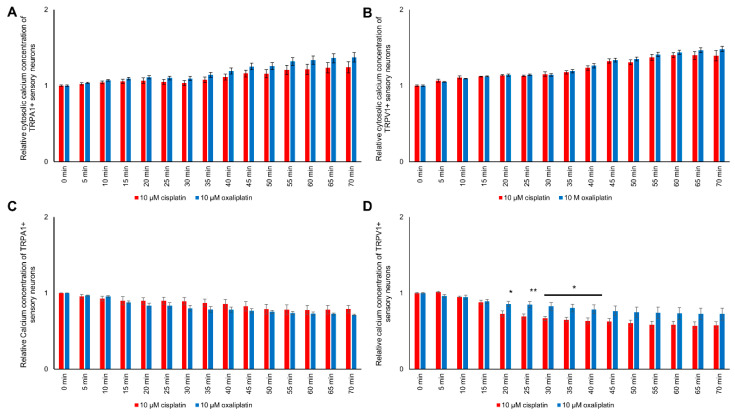
Figure 5.
Relative cytosolic and mitochondrial calcium concentration during exposure to 10 µM cis- or oxaliplatin of TRPA1- or TRPV1-positive DRG neurons. (A) No differences in the cytosolic calcium concentration of TRPA1-positive DRG neurons after exposure to 10 µM cis- or oxaliplatin could be determined (p > 0.05). (B) The cytosolic calcium of TRPV1-positive DRG neurons concentration during exposure to cis- or oxaliplatin showed no difference (p > 0.05). (C) During exposure to 10 µM cis- or oxaliplatin, no difference in the mitochondrial calcium concentration of TRPA1-positive DRG neurons could be determined (p > 0.05). (D) While exposing TRPV1-positive DRG neurons, differences between the two chemotherapeutics on the mitochondrial calcium concentration could be determined after 20 min. The mitochondrial calcium concentration of TRPV1-positive DRG neurons exposed to oxaliplatin was higher at 0.856 ± 0.033 compared to 0.727 ± 0.040 (* p < 0.05). The mitochondrial calcium concentration was higher for oxaliplatin-exposed TRPV1-positive DRG neurons until 0.786 ± 0.058 after 40 min (* p < 0.05). n = 6 cells per condition. * = significant effect between cis- and oxaliplatin, ** p < 0.01

