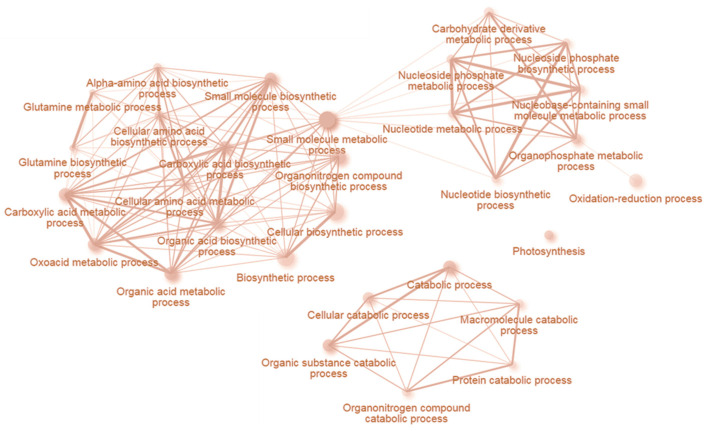
Figure 4.
Visualization of processes mediated by early INCYDE response proteins. Enrichment analysis based on hypergeometric distribution followed by FDR correction. Two pathways are connected if they share 20% or more proteins. Darker and bigger nodes are more significantly enriched and larger sets, respectively. Analyzed by ShinyGO 0.61 [32].

